Prices

November 8, 2018
HRC Futures: Not Just a Boondoggle
Written by Gaurav Chhibbar
Gaurav Chhibbar is a partner at Metal Edge Partners, a firm engaged in Risk Management and Strategic Advisory. In this new role, he and his firm design and execute risk management strategy for clients along with providing process and analytical support.
In Gaurav’s previous role, he was a Trader at Cargill spending time in Metal and Freight markets in Singapore before moving to the U.S. He can be reached at Gaurav@MetalEdgePartners.com for queries/comments/questions.
In the past few weeks, we have been working closely with several clients on managing risk in their supply chain. During one of these interactions, a question came our way from a successful and respectable industry veteran. “I can just buy four months of inventory to cover that sale; aren’t futures just a boondoggle?” Our response to this question was to highlight that there is a cost to buying inventory that is not insignificant. This cost includes the cost of capital, cost of storage, insurance, to name a few. Occasionally, when comparing futures and physical pricing levels, participants do not consider these costs.
In buying futures, one is deploying cash to cover your margin requirement, which is usually far lower than the full cost of the inventory one may plan to lay down to cover a customer’s need. This cash efficiency explains why we are seeing some end-users locking in 2019 prices right now instead of merely front loading their material requirements. This gives me a good segue to go into a quick update of the market.
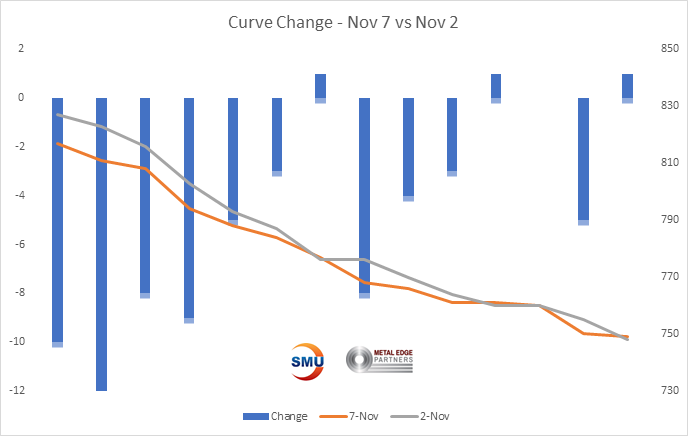
One of the results of this buying activity has been the recent reduction in the backwardation (chart below).

The benchmark index publishing down $11 for this week further resulted in the push down on the front of the curve. This push down on the front end further reduces the steepness of the backwardation.
As seen below, the orange line (curve as of Nov. 7) has moved lower than the grey line (curve as of Nov. 2). The difference of the two curves highlighting the change in the forward curve values is shown in blue bars (left hand axis).

The logic for the U.S. HRC curve remaining backwardated remains intact. The buyers of futures are looking at the spreads between U.S. and international pricing. They are only willing to buy the futures at a discount to spot pricing in the anticipation that the supply picture changes in the months to come. Their concerns are valid if one looks at the markets in Asia. The euphoria around Chinese production cuts seems to have eased off a bit.

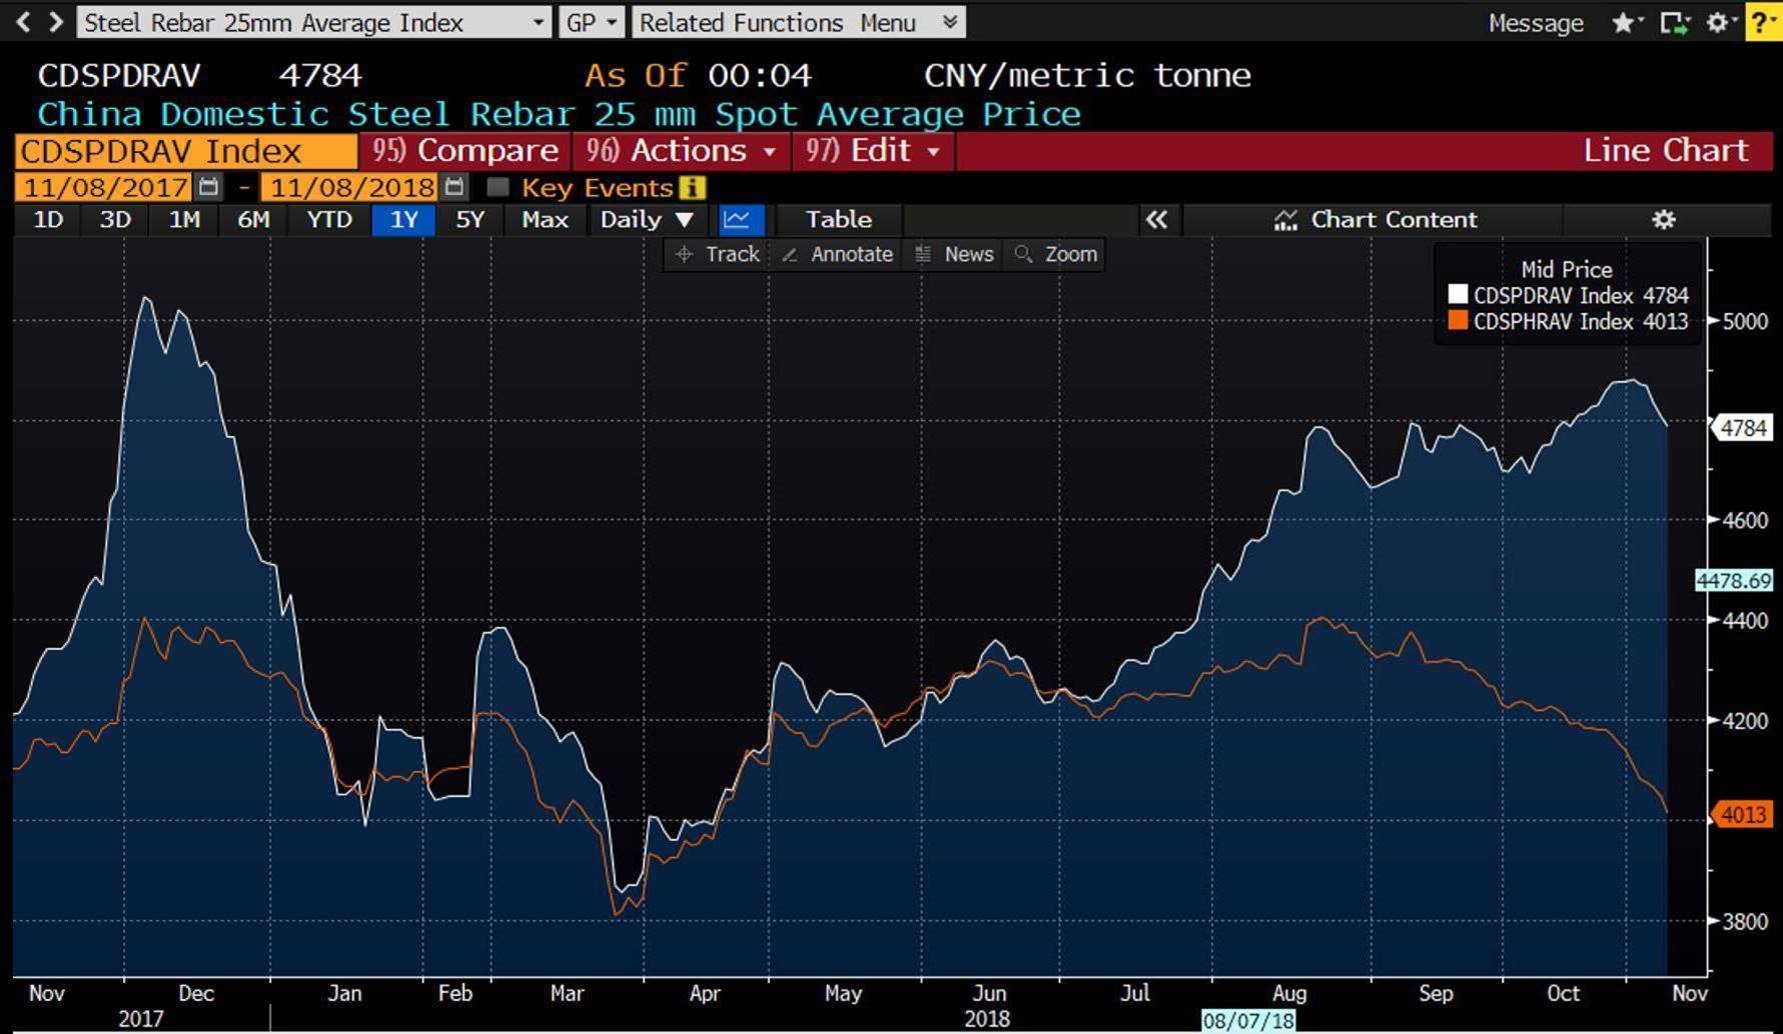
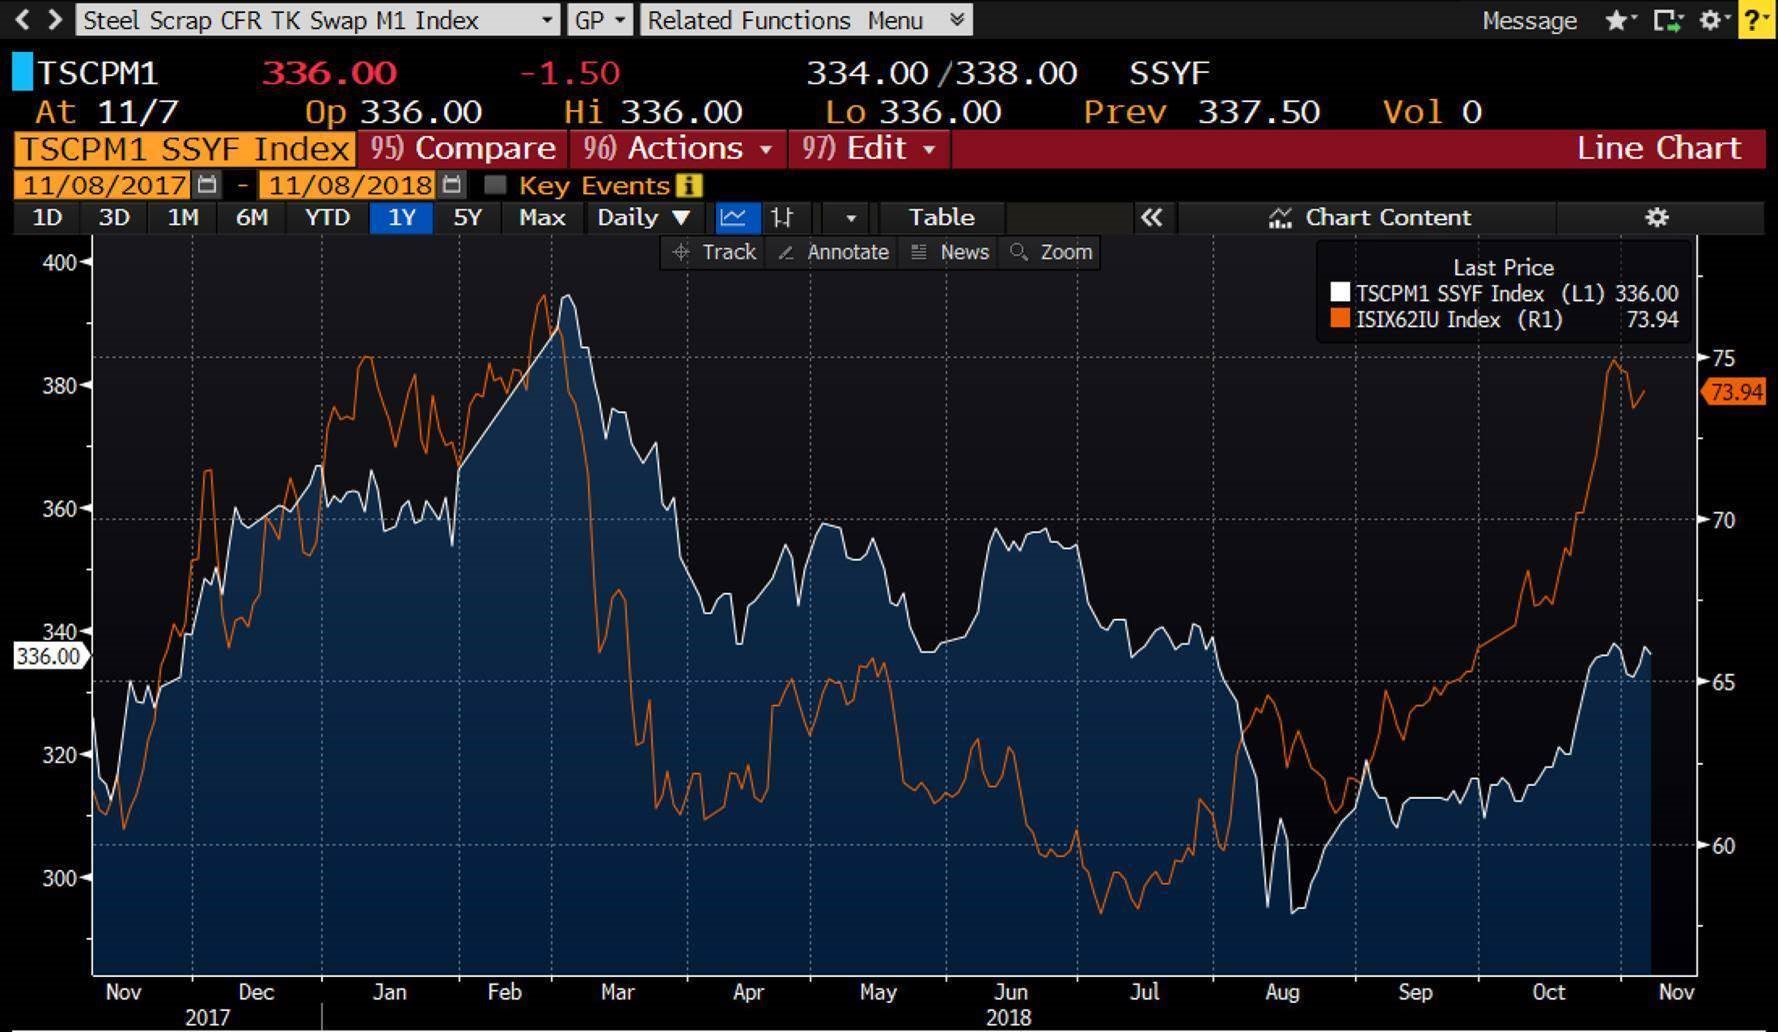
Both rebar (white) and HRC (orange) in China have been under pressure recently, with HRC coming off nearly 10 percent. This has kept SE Asian prices from moving any higher despite a raw material pricing increase. The rising ore prices (orange line in the chart below) further add to the margin compression at Chinese BOFs. The scrap prices too (white line in the chart below) have continued to remain supported.

As we get into the end of 2018, raw material pricing, international offers on finished steel, and inventory levels are all going to remain important factors to assess the relative value of the physical steel versus futures. And to make the most out of trading futures for your firms, it is critical to keep a close eye on these and other factors at play.
Disclaimer: The information in this write-up does not constitute “investment service,” “investment advice” or “financial product advice” as defined by laws and/or regulations in any jurisdiction. Neither does it constitute nor should be considered as any form of financial opinion or recommendation. The views expressed in the above article by Metal Edge Partners are subject to change based on market and other conditions. The information given above must be independently verified and Metal Edge Partners does not assume responsibility for the accuracy of the information.


