

Market Data

November 7, 2018
Industry Inventory-to-Shipments Ratio Improves in First Three Quarters
Written by Peter Wright
The Census Bureau provides monthly data on total U.S. manufacturing inventories, shipments and new orders, as well as data for individual industries, including steel products. The Census Bureau data provides a useful reality check on data from steel industry trade groups such as the American Iron and Steel Institute and the Metals Service Center Institute.
Census Bureau shipments and inventories data, reported in millions of dollars, seasonally adjusted, show that steel shipments and inventories are increasing, but the inventory-to-shipment ratio is decreasing. New orders have exceeded shipments each month of 2018 through September.
![]()
Census Bureau results for September were released on Nov. 5. Figure 1 shows monthly shipments in millions of dollars since 1992 with the year-over-year growth. Shipments are up by 16.4 percent year over year and by 40.1 percent since January 2016, and are now entering the range that existed in 2011 through 2014. Year-over-year growth has been in the double digits since February 2017 as shown by the brown bars in Figure 1. The Census Bureau defines shipments as follows: “Manufacturers’ shipments measure the dollar value of products sold by manufacturing establishments and are based on net selling values, f.o.b. (free on board) plant, after discounts and allowances are excluded. Freight charges and excise taxes are excluded. Multi-industry companies report value information for each industry category as if it were a separate economic unit. Thus, products transferred from one plant to another are valued at their full economic value.”

In our SMU reports, we try where possible to provide information on the same subject from different sources. The data in Figure 1 compares quite well with the AISI weekly crude steel production shown in Figure 2. One is in dollars and the other in tons, but the shape of the curves are quite similar.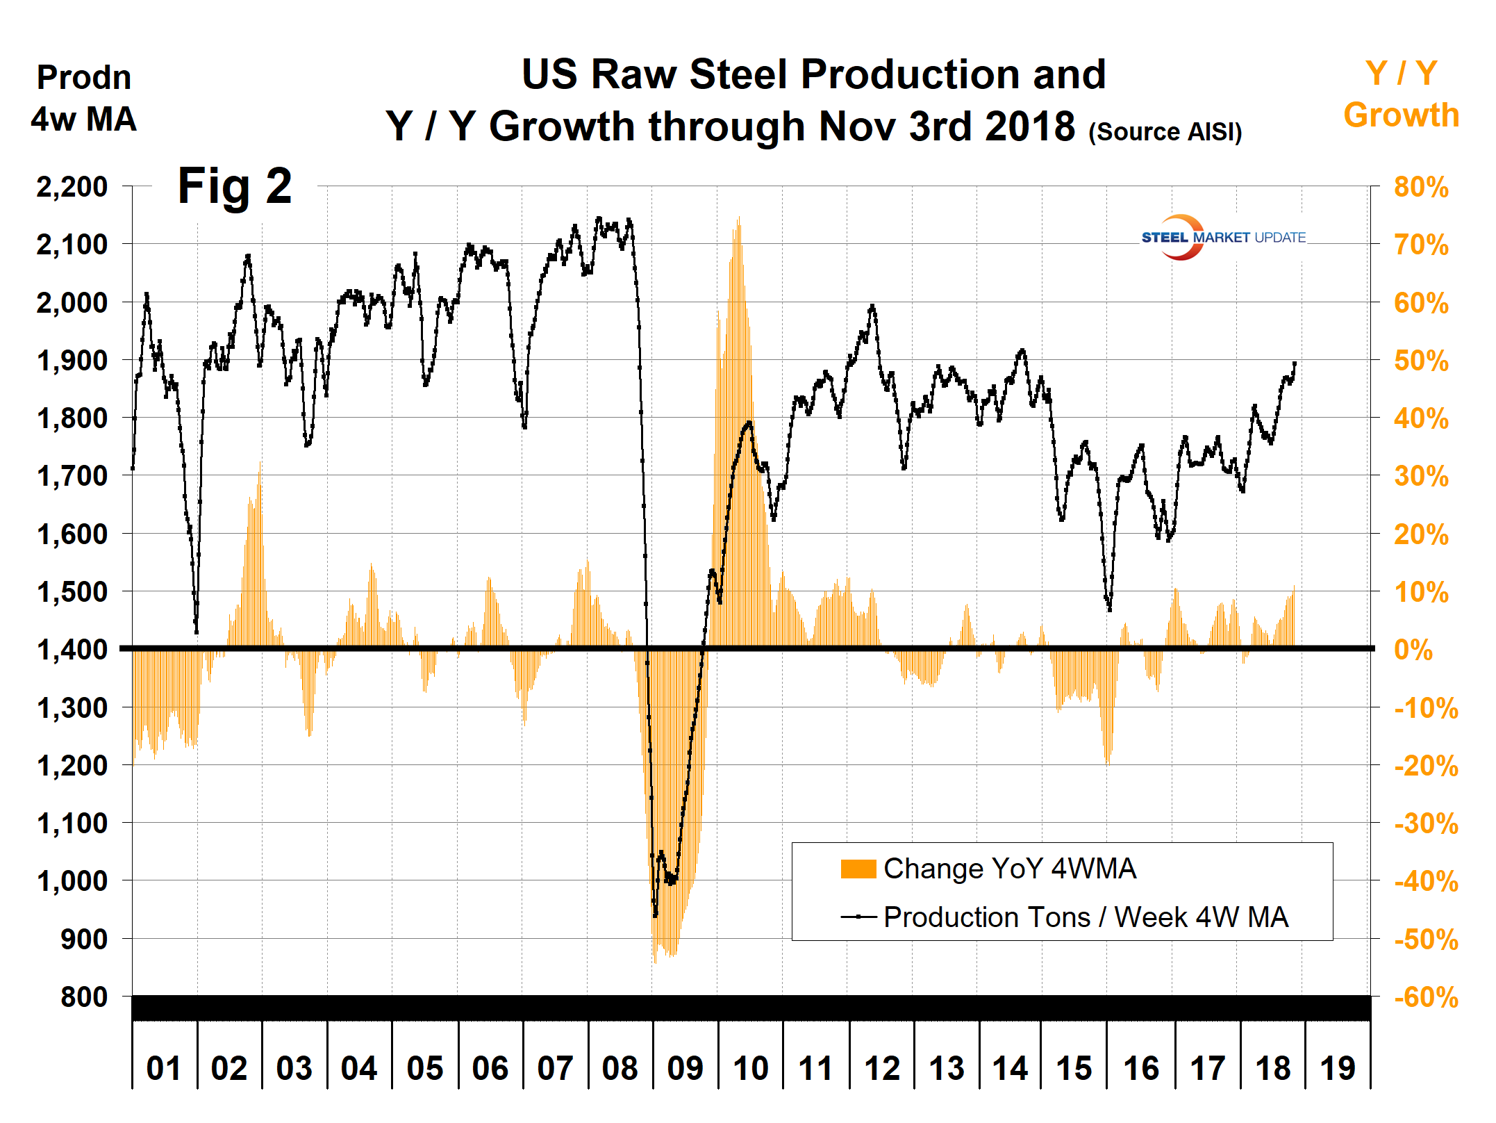
Figure 3 shows shipments and new orders on a monthly basis for all steel products. New orders have exceeded shipments every month in 2018.
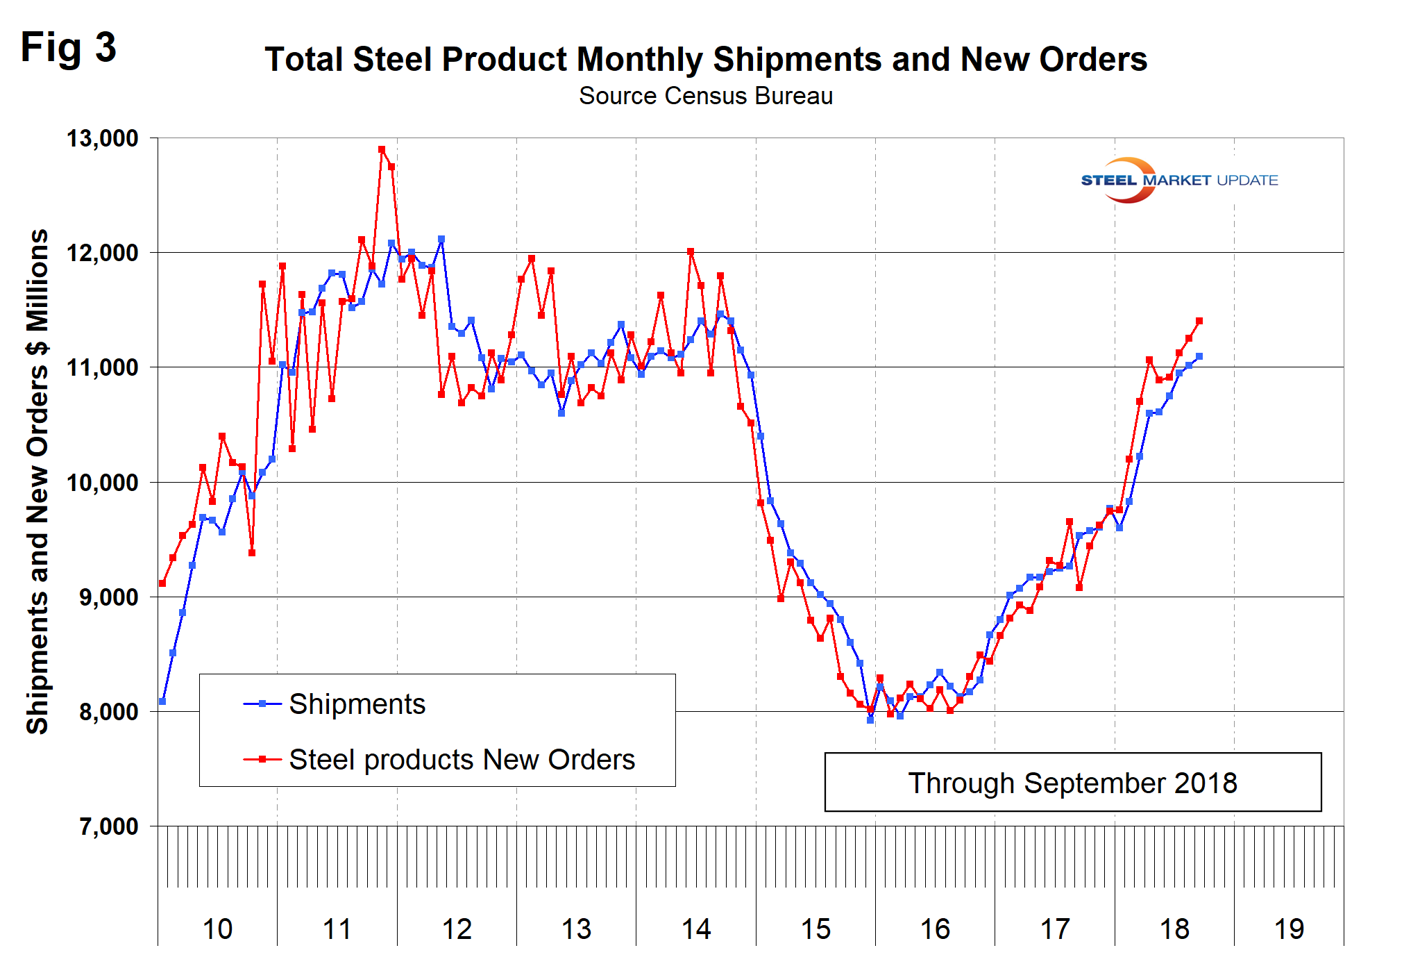
Figure 4 shows the same total shipment line as Figure 1, but now includes the inventory-to-shipment ratio. An excellent trend on both counts.
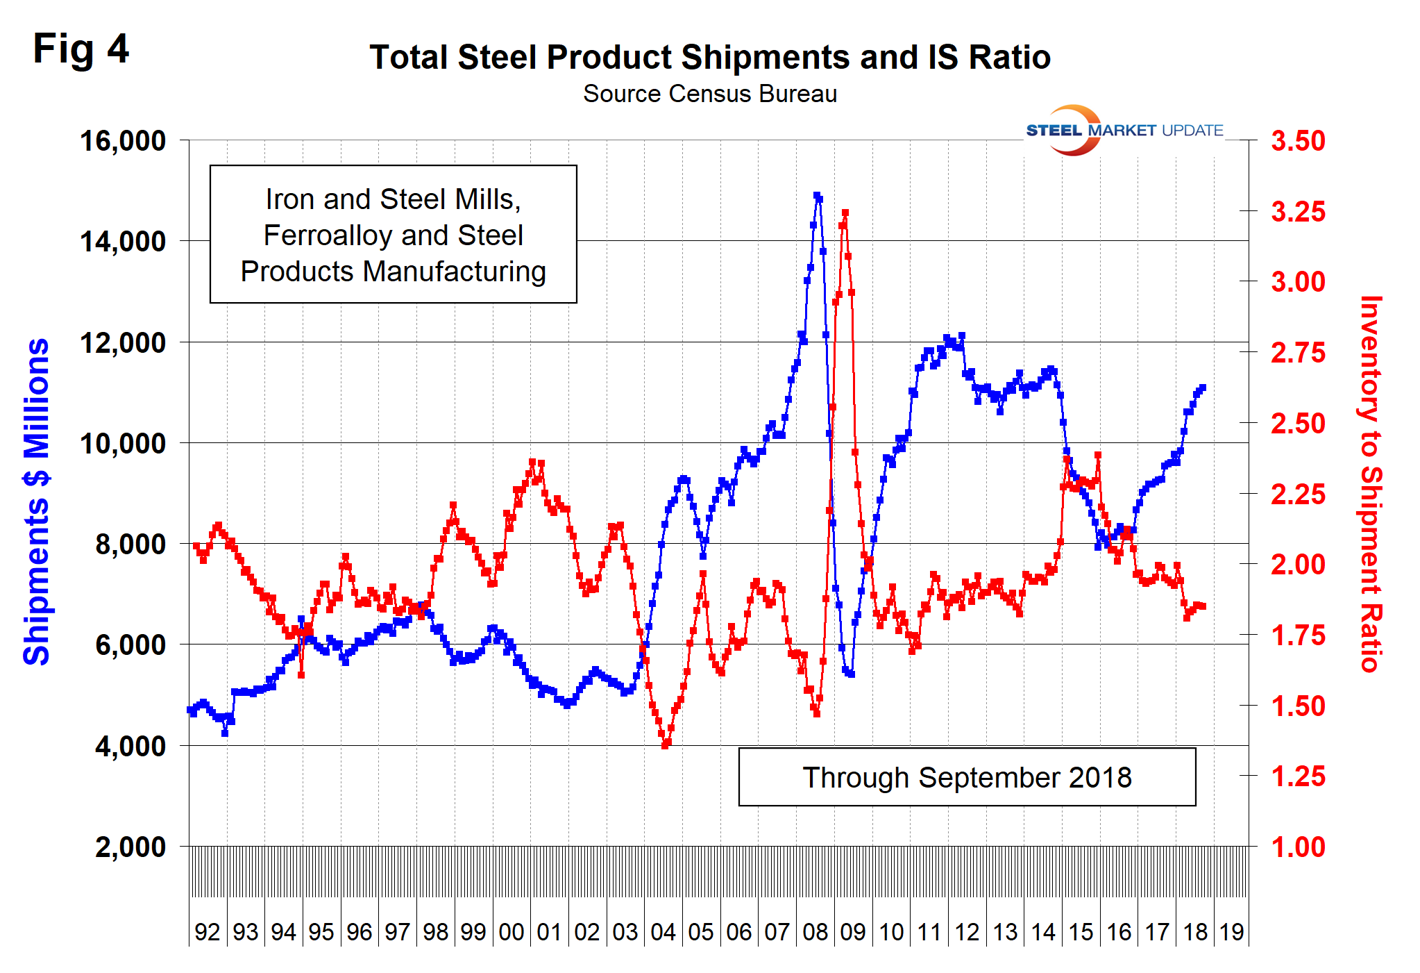
Figure 5 shows total inventory in millions of dollars and repeats the inventory-to-shipment ratio shown in Figure 4. Since January 2016, total shipments have increased by 35.1 percent and inventories have increased by 13.4 percent. The inventory-to-shipment ratio declined from 2.2 to 1.85 in that time frame.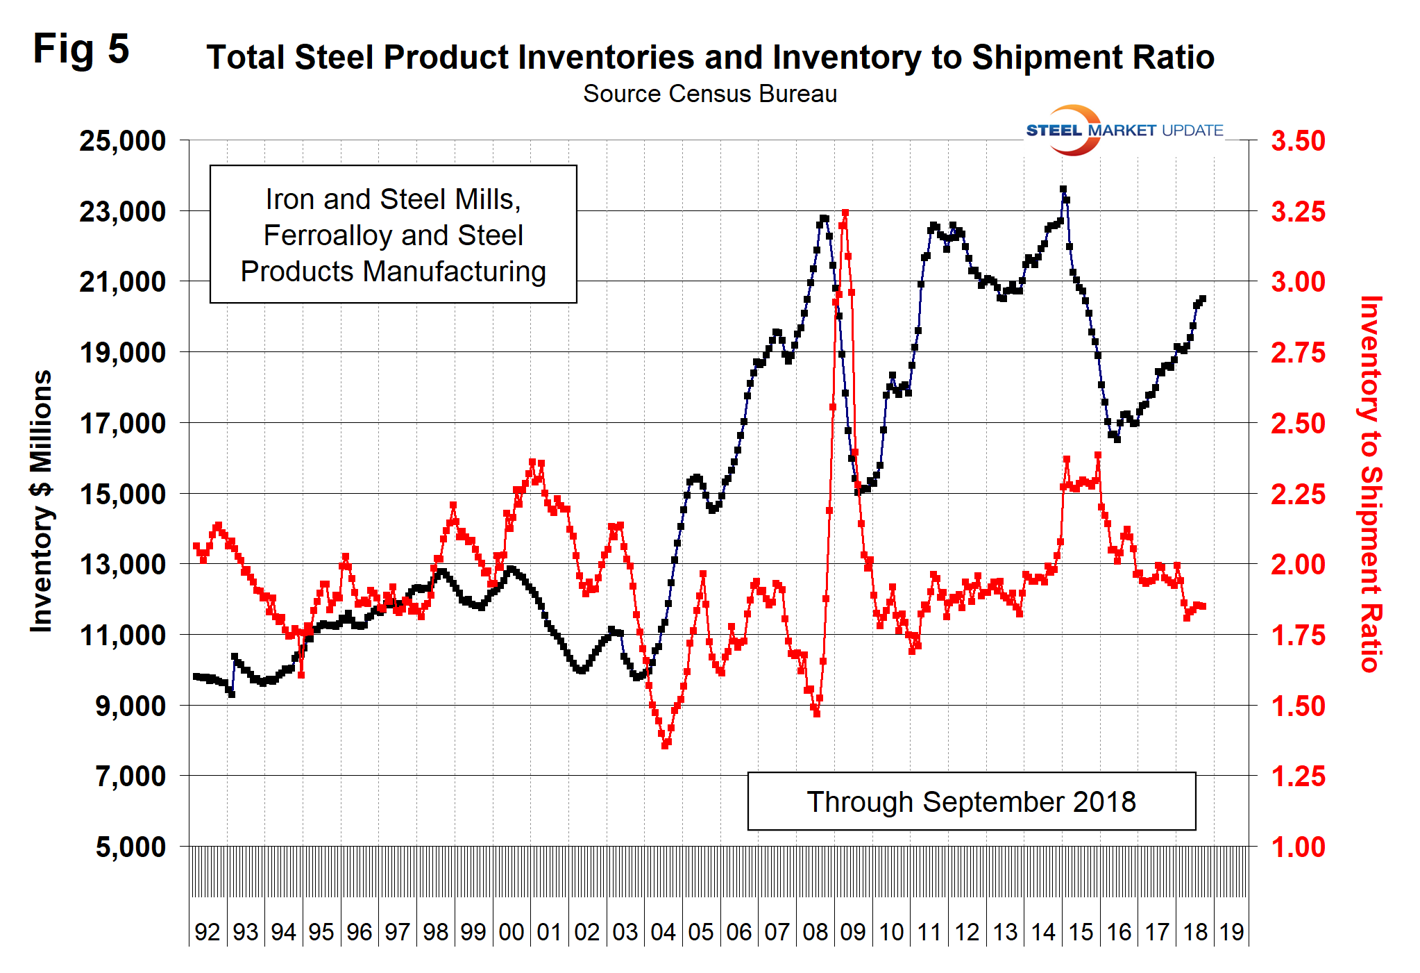
SMU Comment: The situation of steel product orders, shipments and inventories continues to be extremely favorable and our data sources for production and shipments compare well with each other.


