Market Data

October 29, 2018
Global Steel Production on Pace to Top 1.8 Billion Tons
Written by Peter Wright
China continues to outpace the rest of the world in the growth of its steel production.
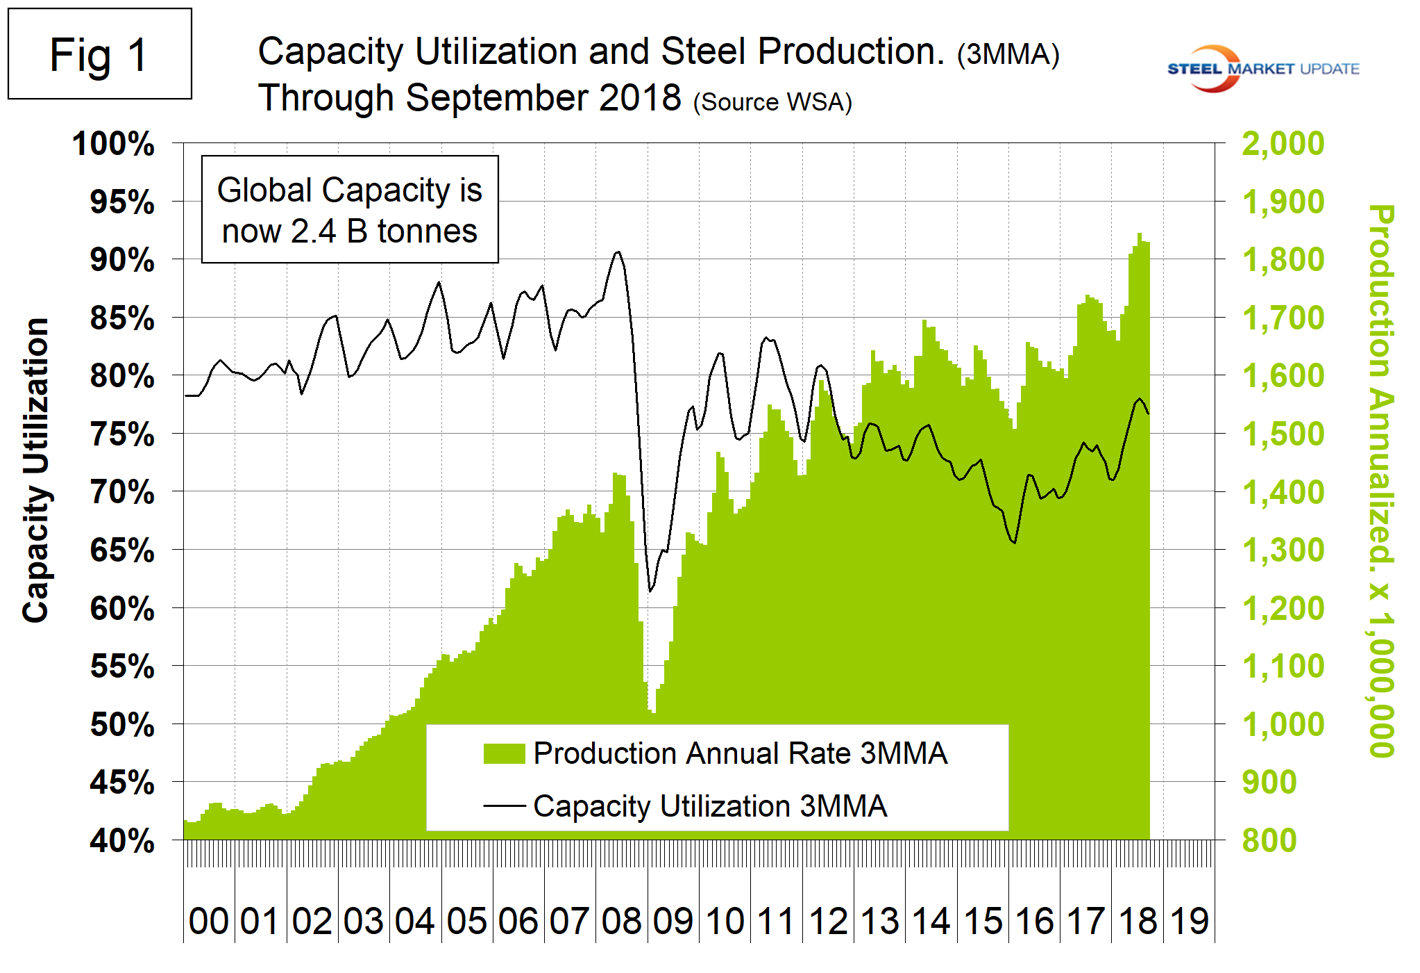
Global steel production in September hit an annual rate of 1.821 billion metric tons. Capacity is calculated to be 2.4 billion metric tons and capacity utilization in September was 76 percent, according to the latest Steel Market Update analysis of World Steel Association data. (Note, these numbers are the same as August’s preliminary values.) In three months through September, production in China grew by 10.0 percent year over year as the rest of the world grew by 1.3 percent. In 2018, China is increasing its share of global steel production, which in September was at another all-time high of 53.3 percent.
Figure 1 shows annualized monthly production on a three-month moving average (3MMA) basis and capacity utilization since January 2000. May through September were the first months for the annualized production rate to exceed 1.8 billion metric tons. On a tons-per-day basis, production in September was 5.057 million metric tons, the first time ever to break five million.
As we dig deeper, we start with seasonality. On average, global production on a tons-per-day basis peaked in the early summer in the years 2010 through 2016, but last year the second-half downtrend was delayed until November and in 2018 there is still no sign of a slowdown. (September dropped a day, which resulted in total production being down but tons per day being up.) Figure 2 shows the average tons per day of production for each month since 2008. On average, September increased by 2.46 percent. This year, September increased by 3.61 percent.
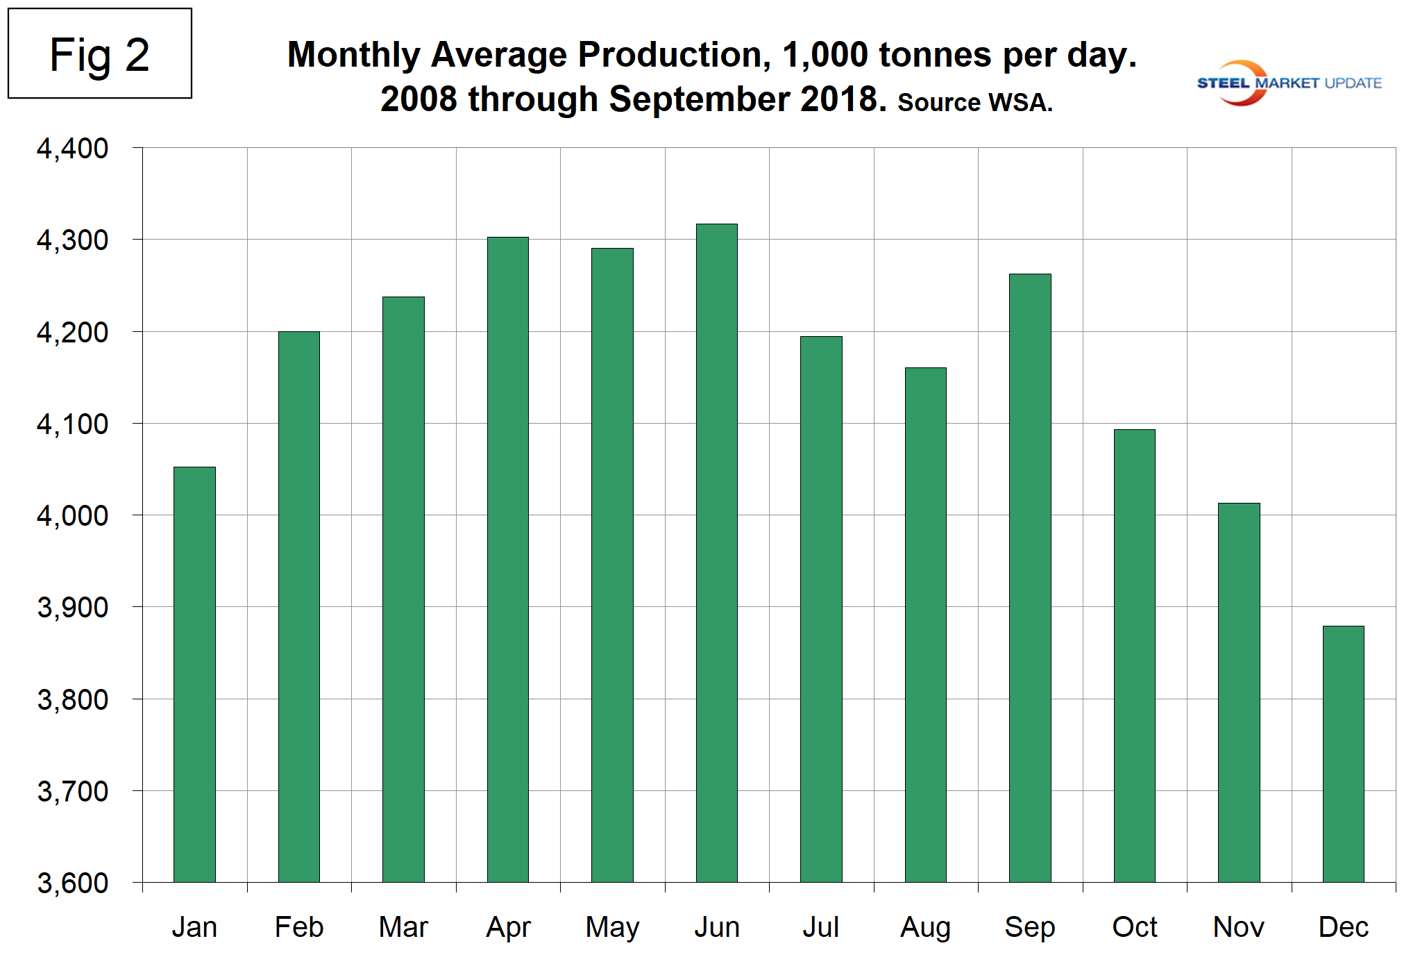
Figure 3 shows the monthly year-over-year growth rate of global production on a 3MMA basis since January 2005. Growth in June, July, August and September was 5.8 percent, 6.1 percent, 5.6 percent and 5.7 percent, respectively.
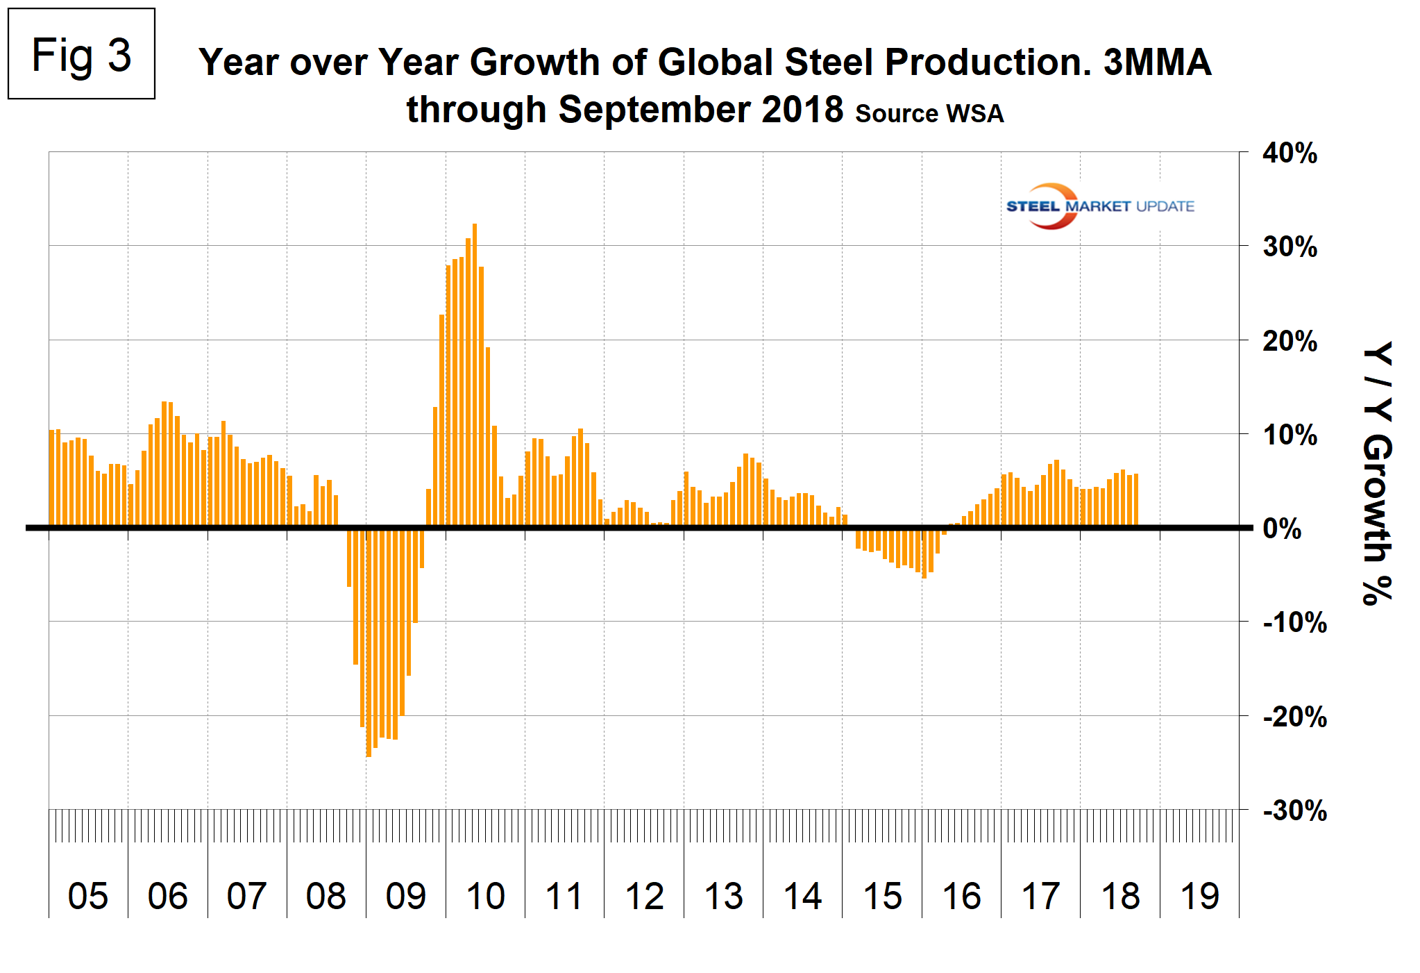
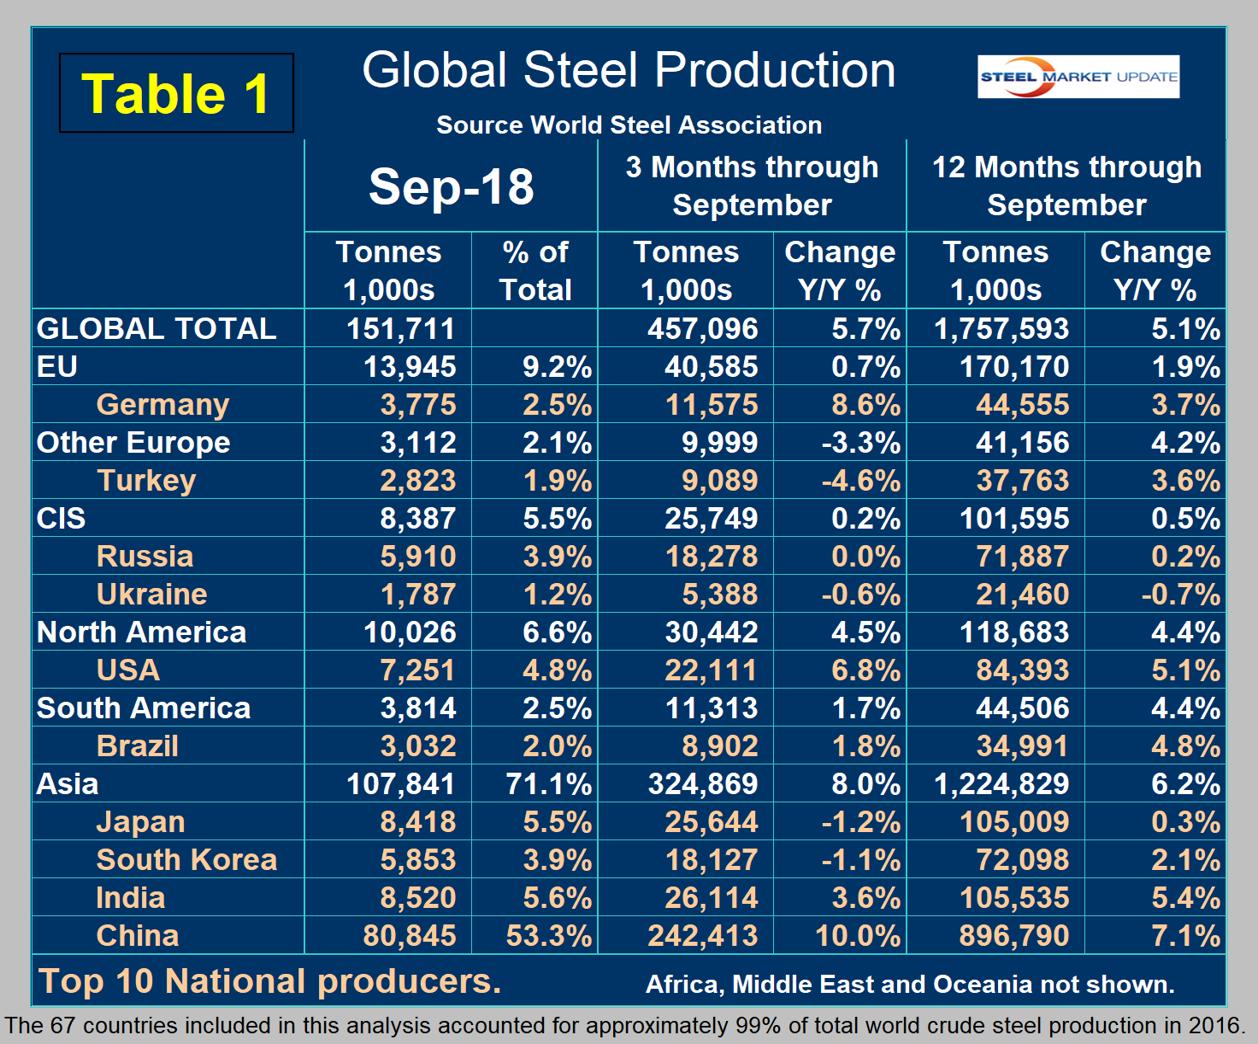
Table 1 shows global production broken down into regions, the production of the top 10 nations in the single month of September, and their share of the global total. It also shows the latest three months and 12 months of production through September with year-over-year growth rates for each period. Regions are shown in white font and individual nations in beige. The world overall had positive growth of 5.7 percent in three months and 5.1 percent in 12 months through September. When the three-month growth rate exceeds the 12-month growth rate, as it did each month June through September, we interpret this to be a sign of positive momentum. These were the first months of positive momentum since October last year. On the same basis in September, China grew by 10.0 percent and 7.1 percent. All regions except other Europe, which was dragged down by Turkey, had positive growth in the three months through September. Table 1 shows that North America was up by 4.5 percent in three months. Within North America, the U.S. was up by 6.8 percent, Canada was down by 4.6 percent and Mexico was up by 1.0 percent. (Canada and Mexico not shown in Table 1.)
In the 12 months of 2017, 115.3 million metric tons were produced in NAFTA of which 70.8 percent, 11.9 percent and 17.3 percent were produced in the U.S., Canada and Mexico, respectively.
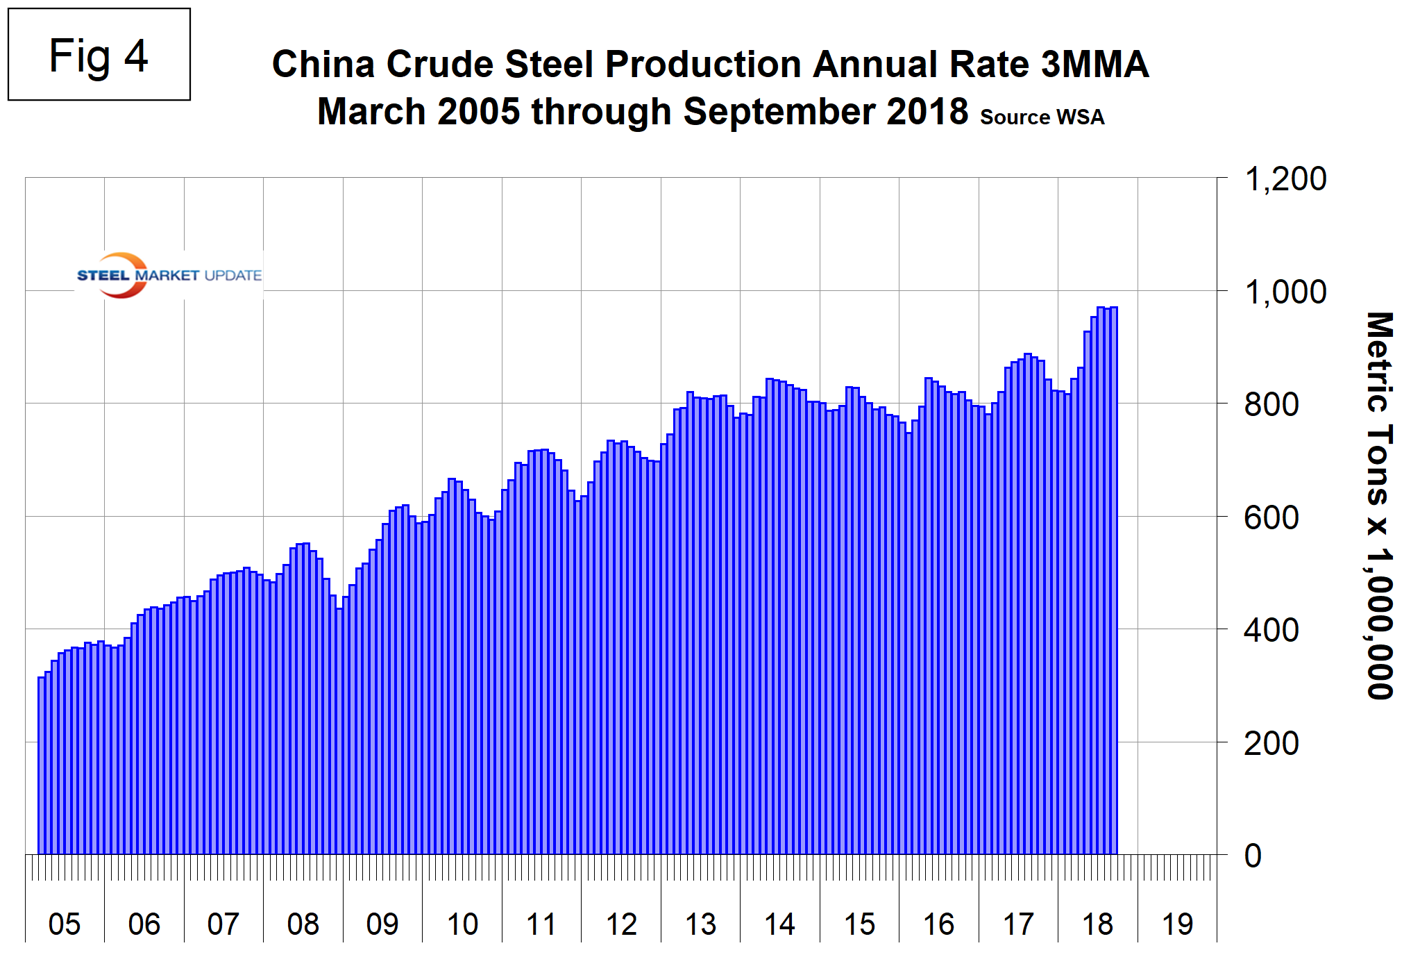
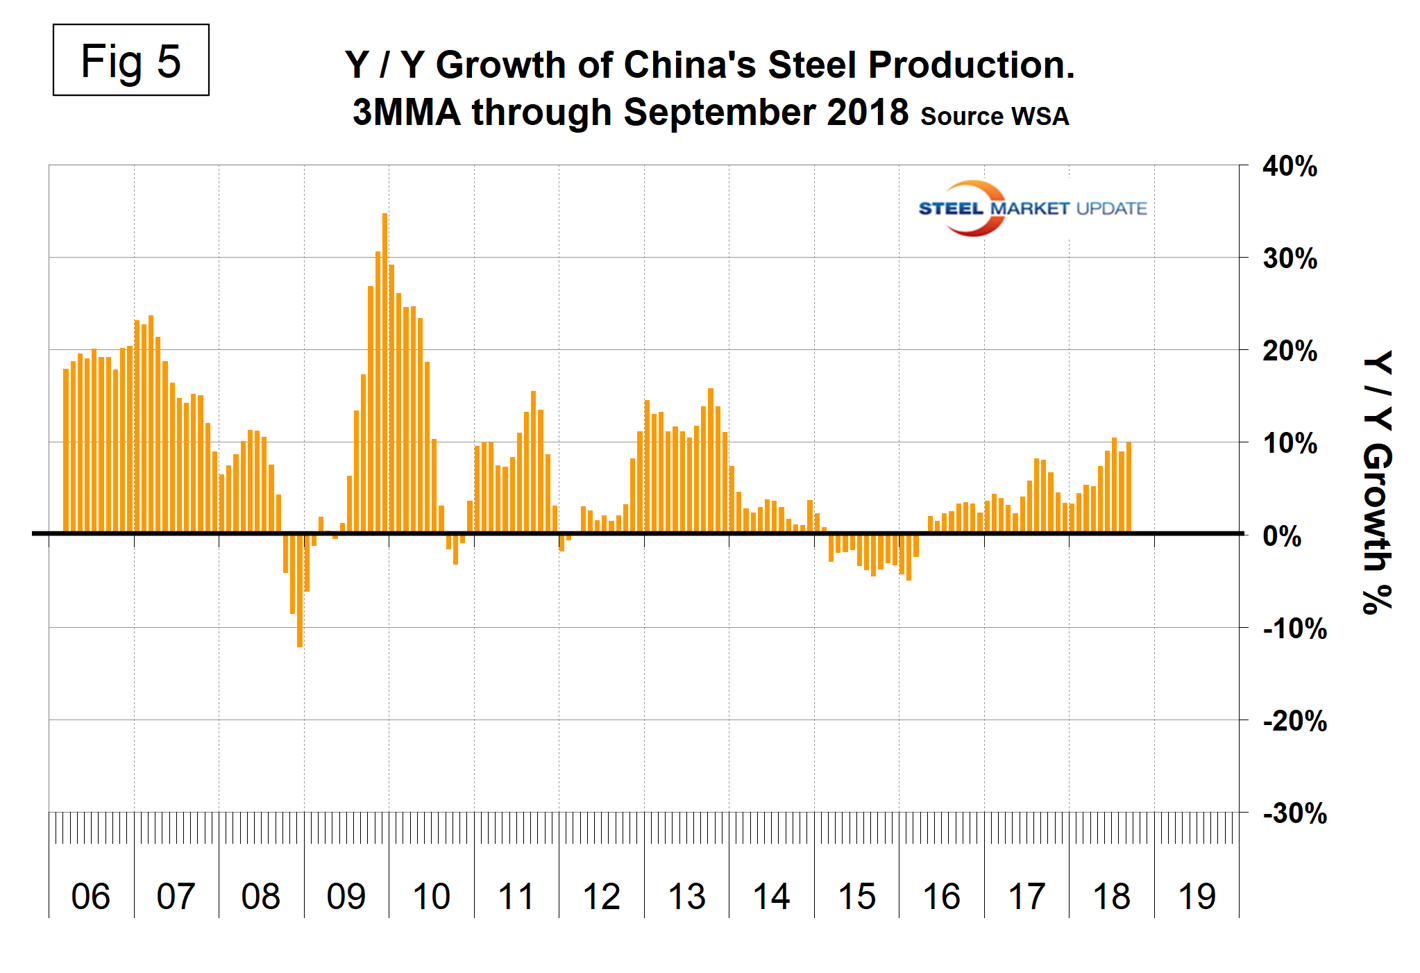
Figure 4 shows China’s production since 2005 and Figure 5 shows the year-over-year growth. China is increasingly dominating the global steel market and is approaching an annual rate of one billion tons of crude production. The WSA is forecasting a deceleration in China’s steel production growth in 2019. Last week, the chairman of the World Steel economics committee said that China is expected to experience zero growth in 2019, down from 6 percent this year. This is partly a result of trade tensions with the U.S., he reported.
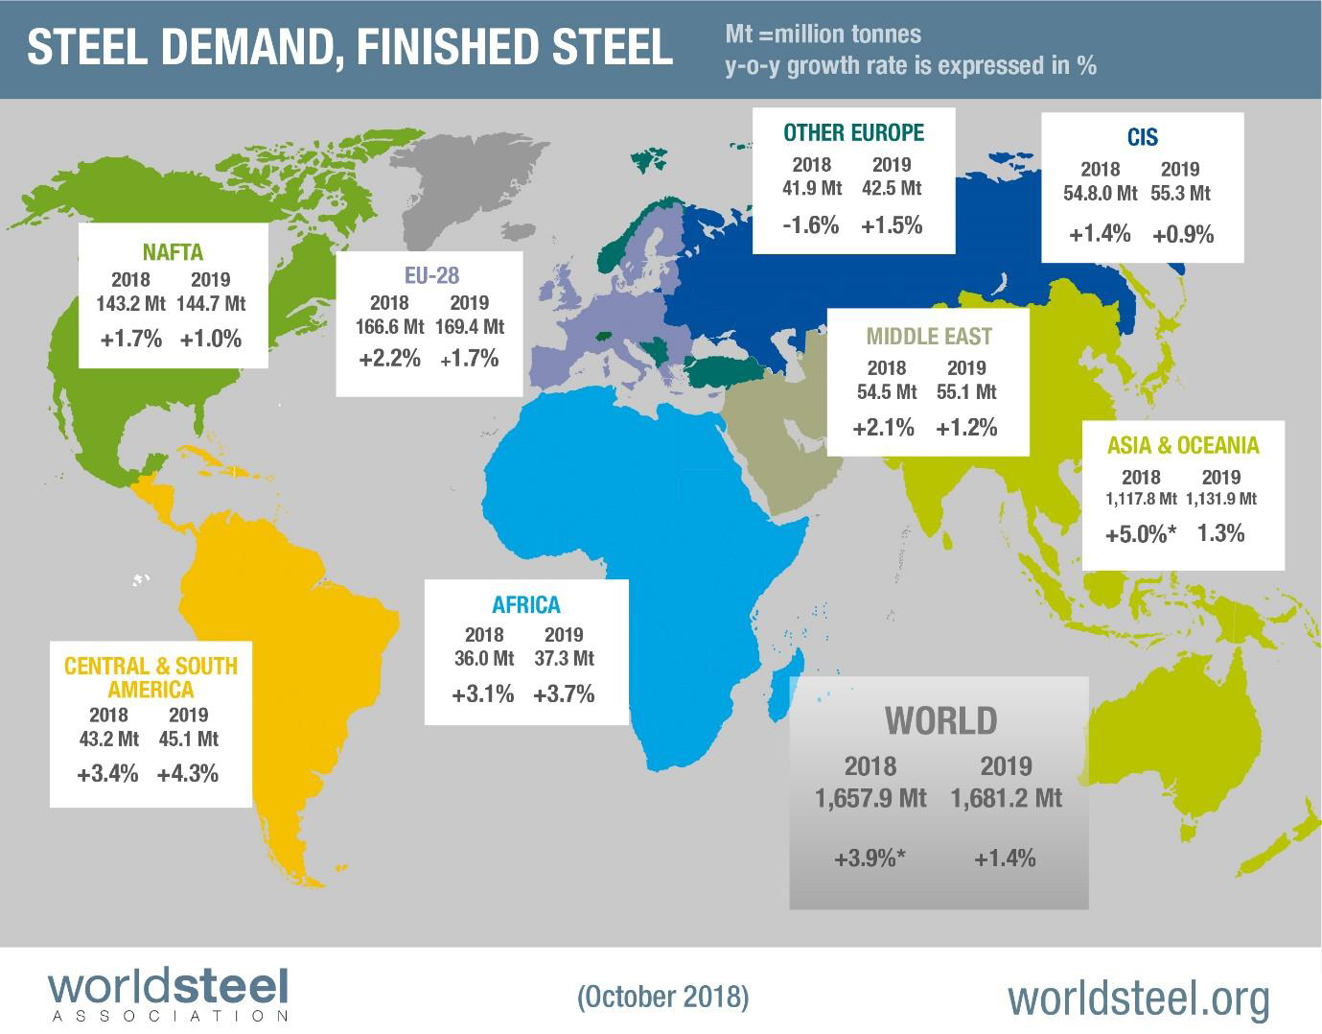
The October WSA Short Range Outlook (SRO) for apparent steel consumption in 2018 and 2019 is shown by region in the graphic below. The WSA forecasts global steel demand will reach 1,657.9 Mt in 2018, an increase of 3.9 percent over 2017. In 2019, it is forecast that global steel demand will grow by 1.4 percent to reach 1,681.2 Mt. The next forecast will be released in April 2019.
Commenting on the outlook, the chairman of the WSA economics committee said, “the outlook for steel demand in the U.S. remains robust on the back of the strong economic fundamentals.”
SMU Comment: Trends have been consistent in recent months as the growth of China’s steel production continues to outpace the rest of the world. New plants are coming on stream and almost all of these are BOF-based, according to the August report by the OECD Steel Committee. For years now, we’ve been reading about China’s intent to reduce steel production. The remarks from the World Steel Association reported in this piece are typical. The fact is it isn’t happening! China’s share of global steel production was at an all-time high in September and their production is growing over seven times as fast as the rest of the world. The IMF released its October projection for global growth in 2018 and 2019 earlier this month and anticipates a 3.7 percent rate in 2019. This is well in excess of the 2.2 percent necessary to generate a continued growth in global steel demand.
This analysis is based on data made public monthly by the World Steel Association. The WSA is one of the largest industry associations in the world. Members represent approximately 85 percent of the world’s steel production, including over 160 steel producers, national and regional steel industry associations and steel research institutes.


