

Market Data

October 5, 2018
SMU Recession Monitor: Predictors Positive
Written by Peter Wright
Indicators of economic activity in the U.S. do not predict a recession any time soon, but the yield curve should be on your radar screen.
Once every three months, the Steel Market Update staff tries to gain insight into the timing of the next recession. Economists consider recessions to be a necessary evil to clear out distortions that have arisen in the economy. Viewed individually, the leading indicators that we track offer limited insight into future economic expansion or contraction. Viewed collectively, they give subscribers a better idea of present and future business activity. Since World War II, most recessions have been preceded by an overheated economy as indicated by low unemployment, tighter monetary policy and rising long-term interest rates.
![]()
Figure 1 provides a history of U.S. recessions since 1970. Recessions occurred in 1974, 1980, 1981, 1990, 2001 and 2008. In Q2 2018, the latest data, the Bureau of Economic Analysis (BEA) reported GDP growth of 4.1 percent. This is a quarter-on-quarter result. On a trailing 12-month basis, GDP growth in Q2 was 2.87 percent. Congressional Budget Office economists expect economic growth to decline in upcoming quarters.
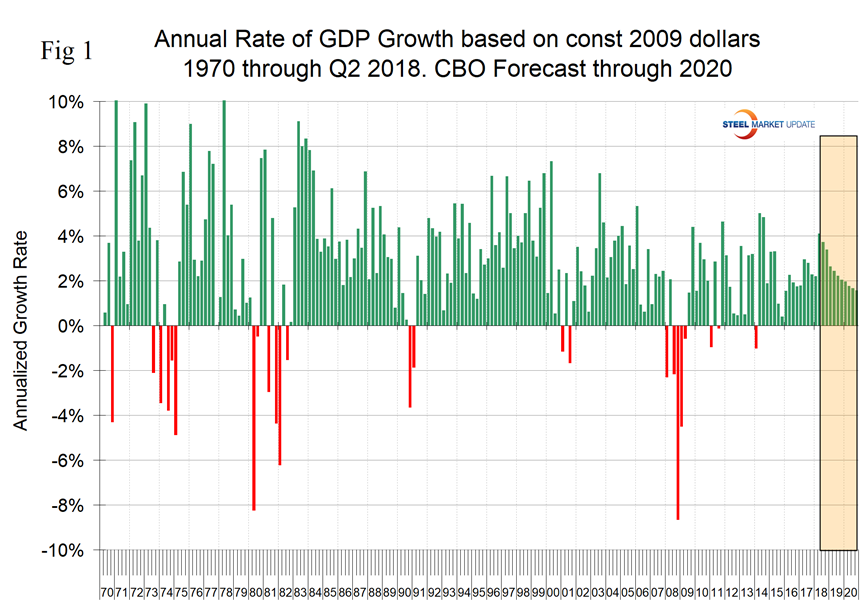
Figure 2 shows the three-month moving average of the S&P 500 on the first day of each month from January 1990 through October 2018. The stock market did predict the recession of 2001, but failed in 2008. Since then there have been several blips that proved of no significance. The tendency is that stock prices decline as investors anticipate a weakening economy and flagging corporate earnings. Fed tightening is also a factor in 2018.
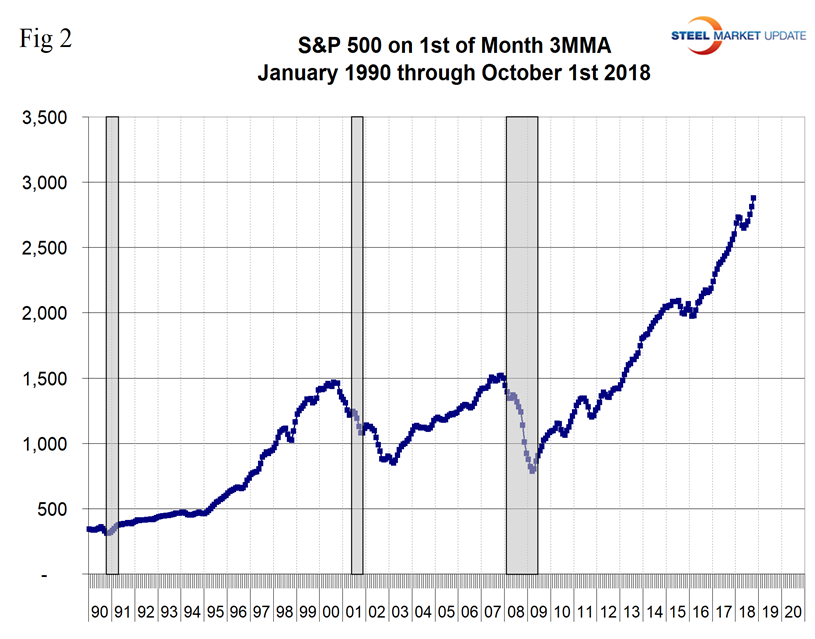
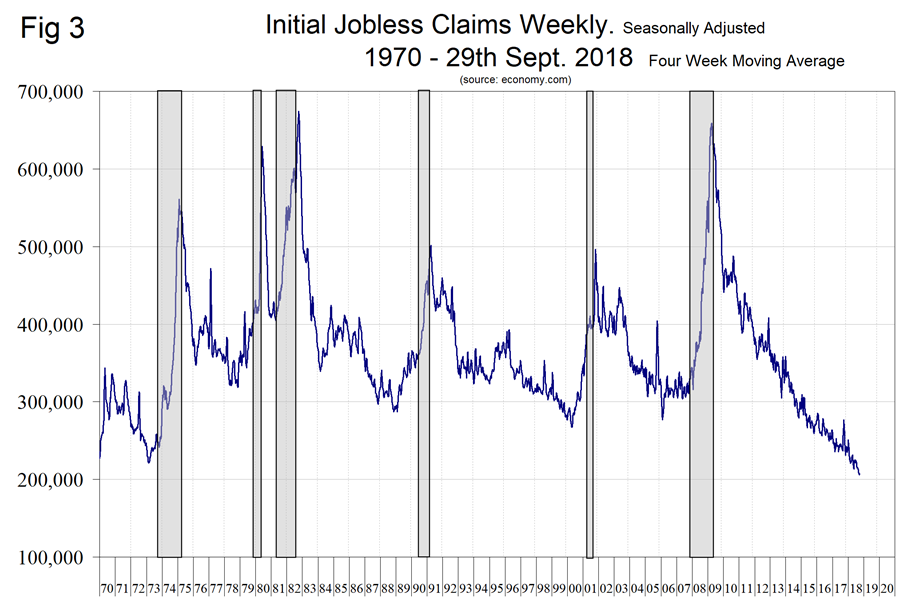
Figure 3 records new weekly claims for unemployment compensation. This indicator failed to predict the 1981 and 2008 recessions. It had a lead of over a year on the other four. Initial claims for unemployment insurance, reported weekly, are a sensitive measure of layoffs. Initial claims are currently at a 50-year low.
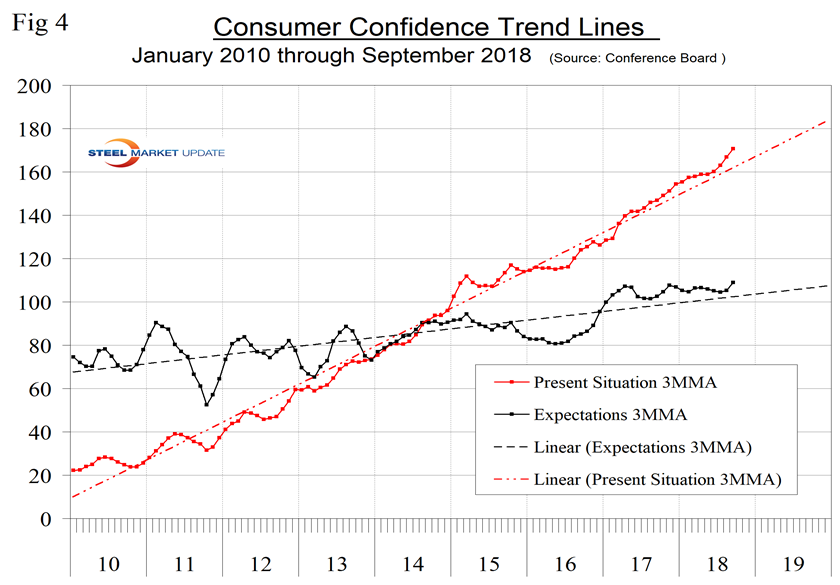
Consumer confidence is another key indicator of economic health. When consumers, businesses and investors lose confidence, it sets up a downward self-reinforcing spiral of reduced spending and investment, causing even higher unemployment and further depressing confidence. Consumers’ sentiment about the present situation and expectations are both strong and above their long-term trend lines (Figure 4).
A decline in housing starts has led every recession since 1970. This seems to be a very prescient indicator. At present there is evidence of slowing, but no sustained decline (Figure 5).
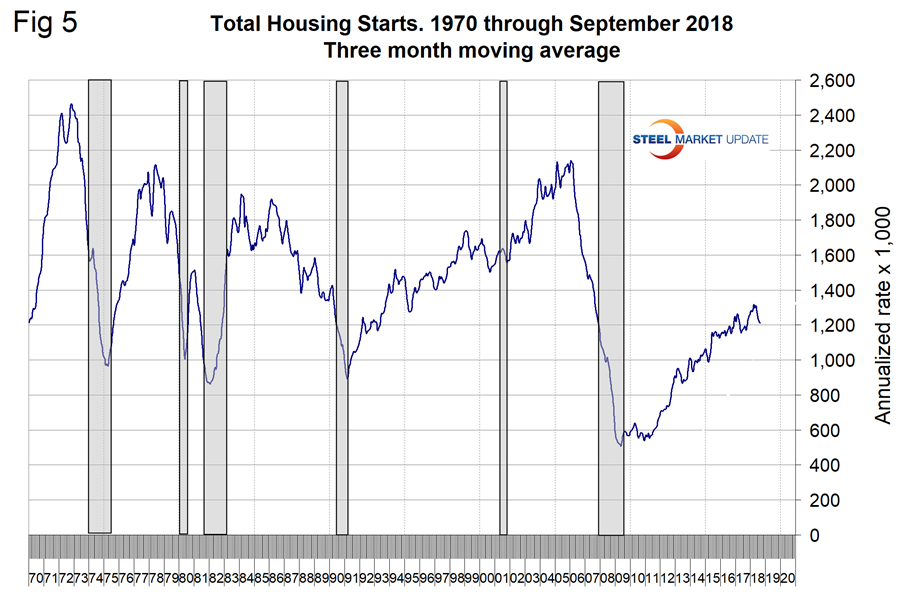
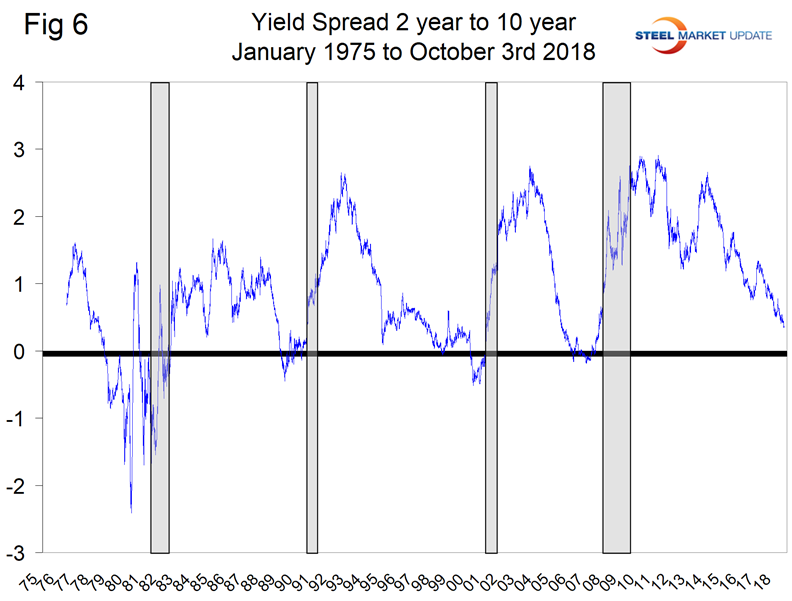
Figure 6 is the well-known yield spread and shows a negative or “inverted” yield curve to be a sign of imminent recession. The treasury spread is developed by subtracting a shorter-term from a longer-term treasury yield. Ten-year interest rates minus two-year interest rates, for example. This has been one of the most accurate and longstanding leading indicators for growth and inflation. A spread that is increasing is a sign of higher growth and inflation as bank lending becomes more profitable (borrow short and lend long) and loan growth is expected to accelerate. A declining or contracting yield spread foreshadows lower growth and inflation due to contractions in bank loan growth due to reduced profitability. The current forecast predicts that lower growth and inflation will materialize toward the end of this calendar year and, more specifically, the first several months of next year. That thesis has been unfolding as the yield curve is contracting. A negative spread anticipated all five of the recessions since 1975. If as expected the Fed continues to raise rates through next year, the yield curve is likely to become almost completely flat meaning that the yield spread will be close to zero. When the spread becomes negative, the money supply is reduced because banks’ loans are earning less than their liabilities, which are deposits.
The Conference Board’s leading and lagging economic index is the chart we like the best, though we have no history before 2008 (Figure 7). We have subtracted one from the other in the rationale that if the lead is better than the lag, the situation is improving, or vice versa. The lead minus lag inverted three years in advance of the 2008 recession; certainly by 18 months before the big event it was clear something was happening. Through August this year, the spread was very healthy and widening.
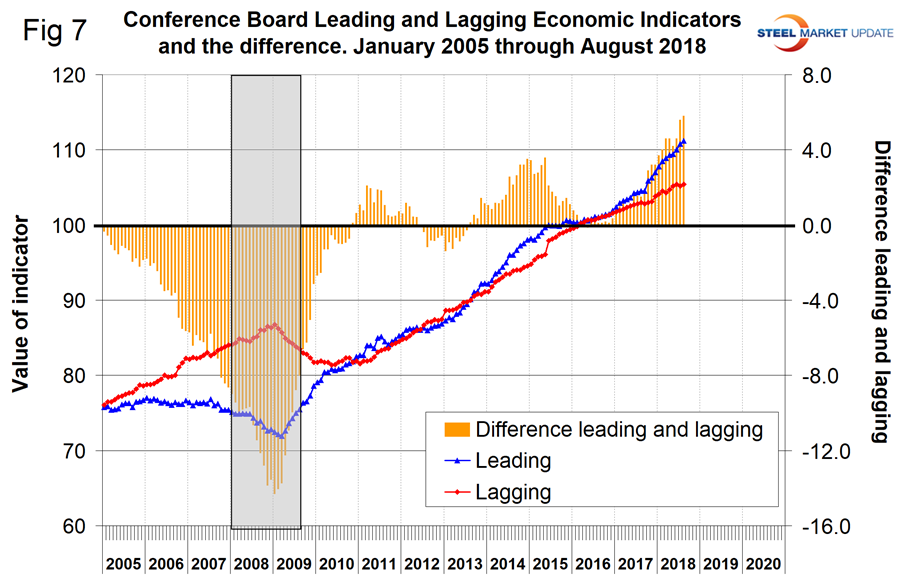
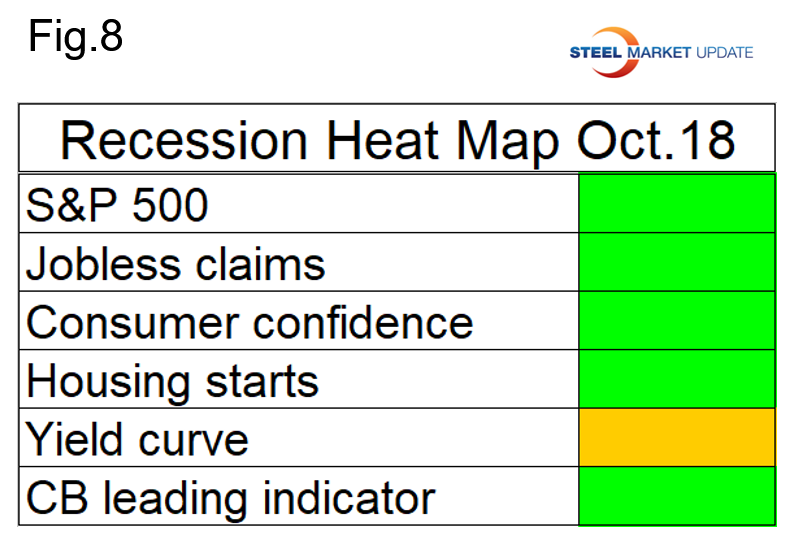
Figure 8 summarizes this data as a recession heat map. Only the yield curve is showing signs of distress. Unfortunately, that has been a powerful indicator in the past.
A study of the current data shows a generally healthy U.S. economy. We currently perform this update every three months and continue to refine it. When we see a recession on the horizon, we will report more frequently.


