Market Data

October 4, 2018
SMU Steel Buyers Sentiment Index: Numbers Inch Up
Written by Tim Triplett
The attitudes of steel buyers and sellers, as measured by this week’s SMU Steel Buyers Sentiment Index questionnaire, are slightly more optimistic than they were last month.
The goal of the index is to measure how buyers and sellers of steel feel about their company’s ability to be successful today (Current Index), as well as three to six months into the future (Future Index). Results are posted as both a single data point and as a three-month moving average, which smooths out the numbers and provides a clearer view of the trend.
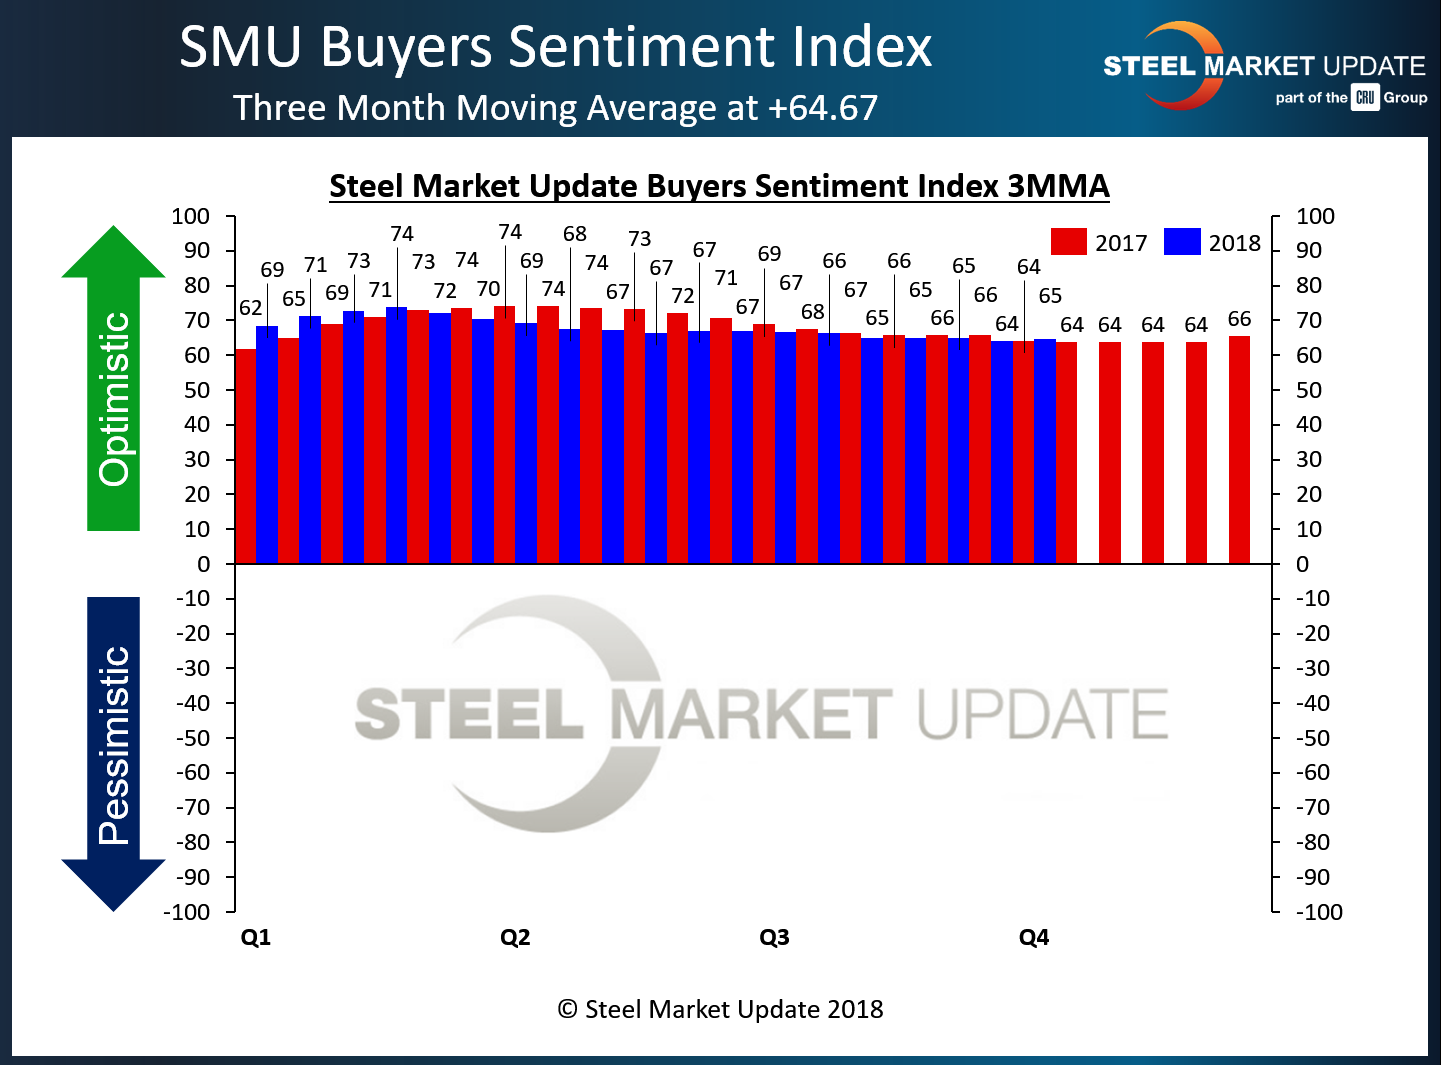
Measured as a single data point, both Current and Future Sentiment registered +67 in the latest index, both up from +61 two weeks ago. Current Sentiment is at its highest level since May and Future Sentiment its highest since August. Both saw their high points for the year, as well as the highest readiing in the history of our index, in January with readings around +77/78. At this time last year, Current Sentiment registered +55 and Future Sentiment +60. So, the attitudes of steel executives are more optimistic than a year ago, but down a bit from early in 2018.
As you can see by the 3-month moving average graphic, Current Sentiment has returned to levels seen at this time last year. It is normal for our index to have a summer “swoon” dropping modestly from first and early second quarter highs. This year the swoon started early and it is our belief this is entirely due to the shock of the Section 232 tariffs and the uncertainty the tariffs introduced into the market. Recent developments are leading some in the industry to believe there is light at the end of the tunnel and countries such as Mexico and Canada are going to be able to ship steel into the U.S. in the not too distant future.
Any reading above zero (+) indicates those responding to SMU’s survey are optimistic about the markets. When numbers go negative (-), this represents a pessimistic group of buyers and sellers. In its history, the index has ranged from lows of -85 (March 1, 2009) to as high as +78 measured earlier this year.
Measured as a three-month moving average, Current Sentiment is now at +64.67, up slightly from two weeks ago, but still near the low point of the year, while remaining at an optimistic level.

Future Steel Buyers Sentiment Index
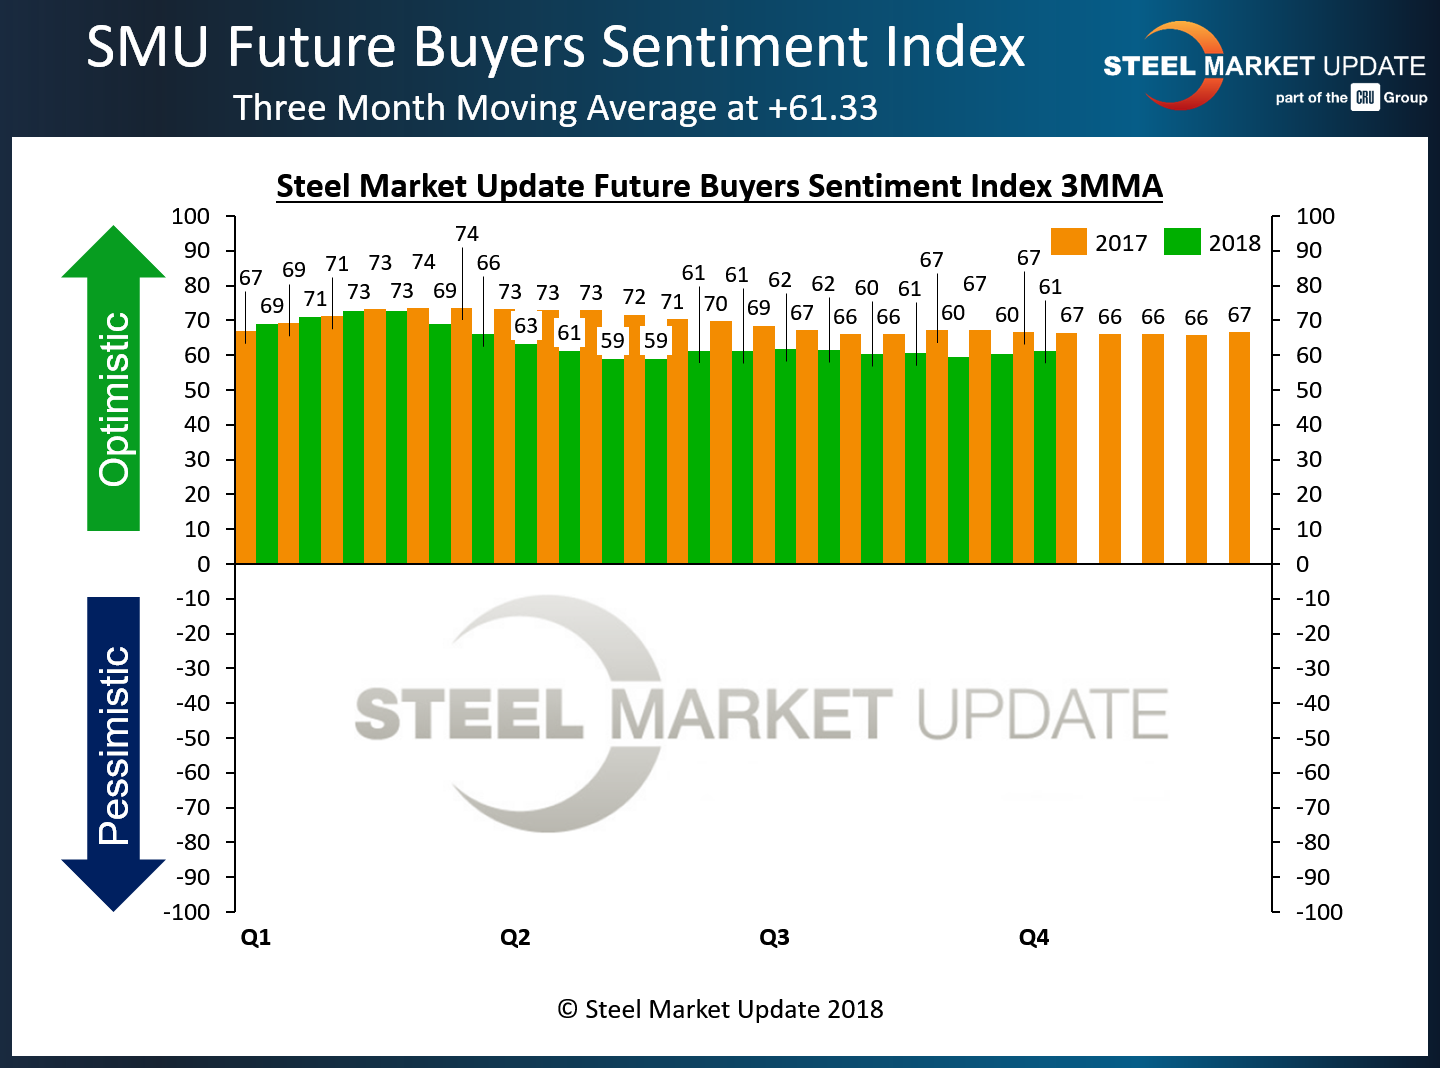
Future Sentiment registered a 3MMA average of +61.33 in the latest data, up a full point from mid-September. At this time last year, the 3MMA for Future Sentiment was significantly higher at +66.67. The Future Sentiment Index has been dragging behind year ago levels. We are seeing it stabilize, but at lower levels than what we normally see at this time of the year. It appears that it may be trying to break out to the upside, and this will be important as we try to gage the possible strenth of the market moving into 1Q 2019.

What Respondents are Saying
- “Too much uncertainty.”
- “Section 232 is killing downstream manufacturers.”
- “Import restrictions and uncertainty on Section 232 will keep prices artificially high and restrict the ability of manufacturers to obtain competitive raw materials.”
- “We have to find alternative ways and products to keep developing business. Demand seems to be okay. While down from the frenzied level due to restrictions on availability, it is still good for the construction markets in general.”
About the SMU Steel Buyers Sentiment Index
SMU Steel Buyers Sentiment Index is a measurement of the current attitude of buyers and sellers of flat rolled steel products in North America regarding how they feel about their company’s opportunity for success in today’s market. It is a proprietary product developed by Steel Market Update for the North American steel industry.
Positive readings will run from +10 to +100 and the arrow will point to the righthand side of the meter located on the Home Page of our website indicating a positive or optimistic sentiment. Negative readings will run from -10 to -100 and the arrow will point to the lefthand side of the meter on our website indicating negative or pessimistic sentiment. A reading of “0” (+/- 10) indicates a neutral sentiment (or slightly optimistic or pessimistic), which is most likely an indicator of a shift occurring in the marketplace.
Readings are developed through Steel Market Update market surveys that are conducted twice per month. We display the index reading on a meter on the Home Page of our website for all to see. Currently, we send invitations to participate in our survey to more than 600 North American companies. Our normal response rate is approximately 110-150 companies. Of those responding to this week’s survey, 41 percent were manufacturers and 48 percent were service centers/distributors. The balance was made up of steel mills, trading companies and toll processors involved in the steel business. Click here to view an interactive graphic of the SMU Steel Buyers Sentiment Index or the SMU Future Steel Buyers Sentiment Index.


