

Market Data

September 20, 2018
SMU Energy Analysis: Oil Tops $70, But Rig Count's Flat
Written by Peter Wright
Steel Market Update is sharing this Premium-level content with all readers this month. For more information on how to upgrade to a Premium subscription, email info@SteelMarketUpdate.com.
Oil production in the U.S. hit another all-time high in July, but the number of operating rigs exploring for oil and gas has not changed much in 3½ months.
The spot price of West Texas Intermediate (WTI) has climbing erratically since June 2017. In the six months through mid-October, the price has been above $70 per barrel three times, closing at $71.84 on Oct. 15 and up from $68.86 in our last report of mid-September. The total number of operating rigs exploring for oil and gas has been essentially unchanged since June 1. The prices of oil and natural gas drive the consumption of energy-related steel products including oil country tubular goods, pipe fittings and well head equipment, among others. Welded tubular goods (not including OCTG) consumed about 5.5 million tons of hot rolled sheet in 2017.
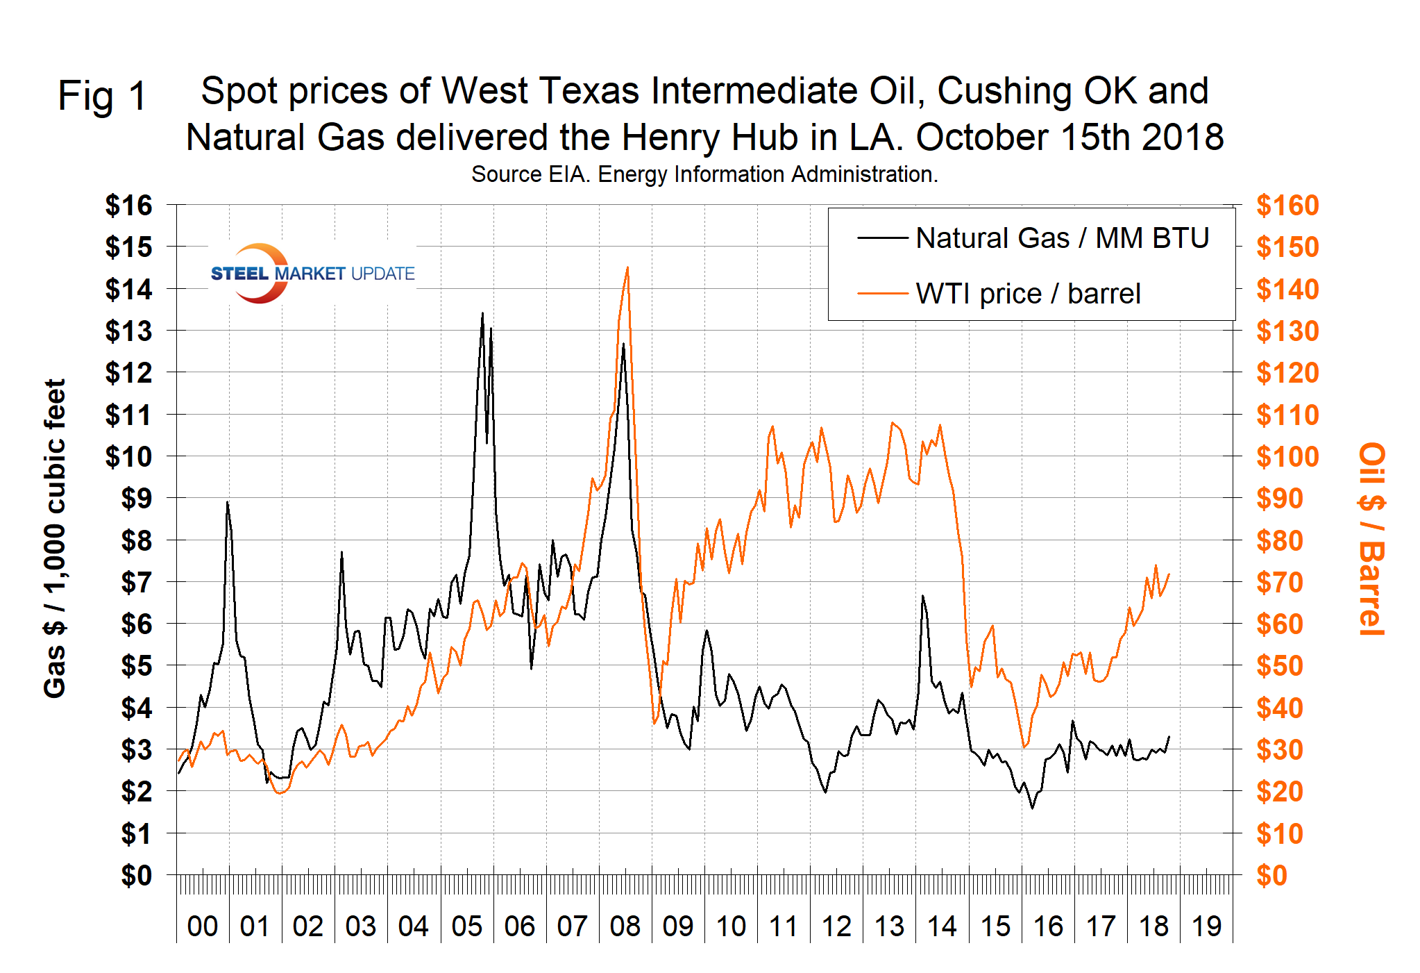
Figure 1 shows historical oil and gas prices from January 2000 through Oct. 15, 2018. Our price and inventory data come from the Energy Information Administration (EIA). WTI was priced at $71.84 per barrel on Oct. 17, Brent crude was $80.91 realizing a differential of $9.07. September and October were the first months for the premium to be greater than $9.00 since February 2015. EIA expects Brent spot prices to average $72 per barrel in 2018 and $71 per barrel in 2019 with WTI averaging about $6 lower.
The price of natural gas at the Henry Hub in Louisiana, except for a few short-lived spikes, has made no progress in two years. Gas closed at $3.30 on the Oct. 12. EIA expects Henry Hub natural gas spot prices to average $2.96/million British thermal units (MMBtu) in 2018 and $3.10/MMBtu in 2019.
Stocks of crude oil in the U.S. are continuing to decline and are now lower than at any time since February 2015. Figure 2 shows the inventory level, including the strategic petroleum reserve and the year-over-year change.
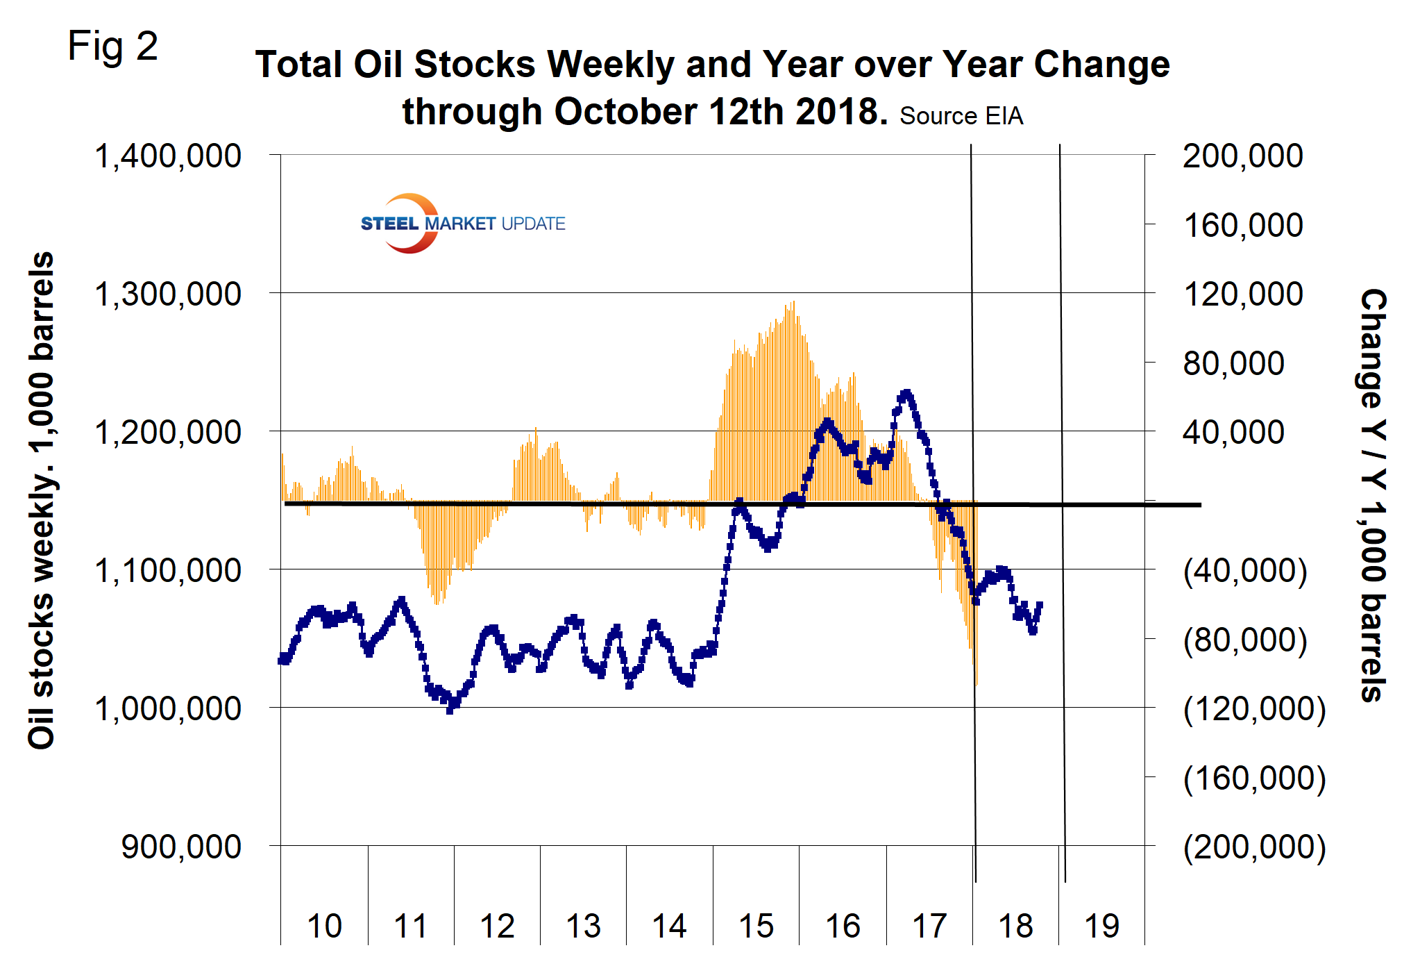
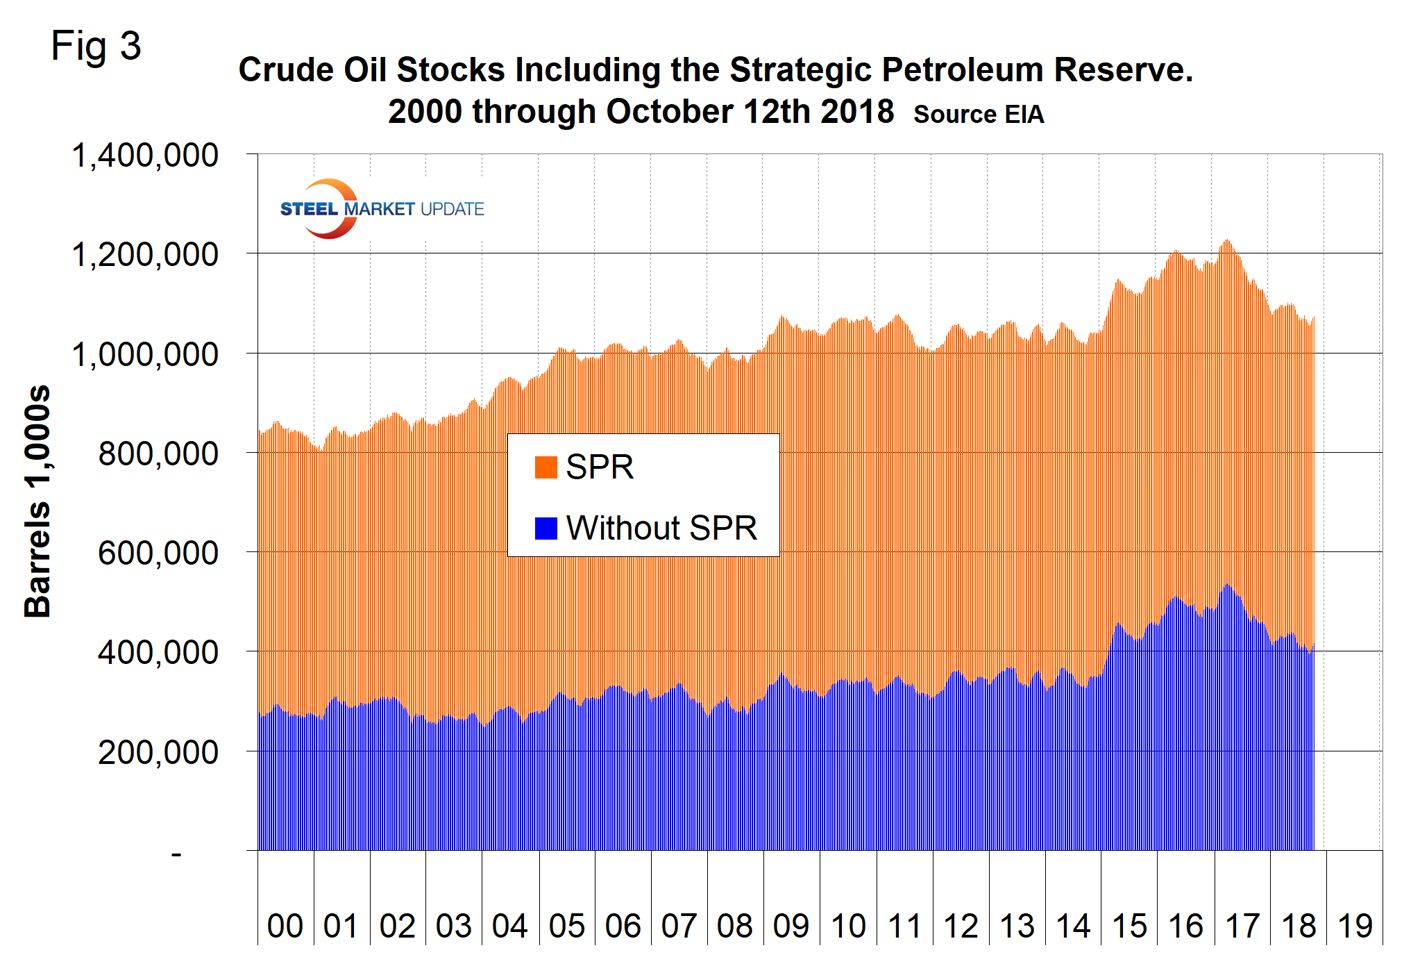
Figure 3 breaks total crude inventory into the working portion and the strategic petroleum reserve. Total inventories are down by 54 million barrels year over year.
The total number of operating rigs in the U.S. on Oct. 19 was 1,067, up from 924 at the beginning of this year. Figure 4 shows the total number of operating rigs in the U.S. and the weekly change. The count curve has been basically flat since June 1.
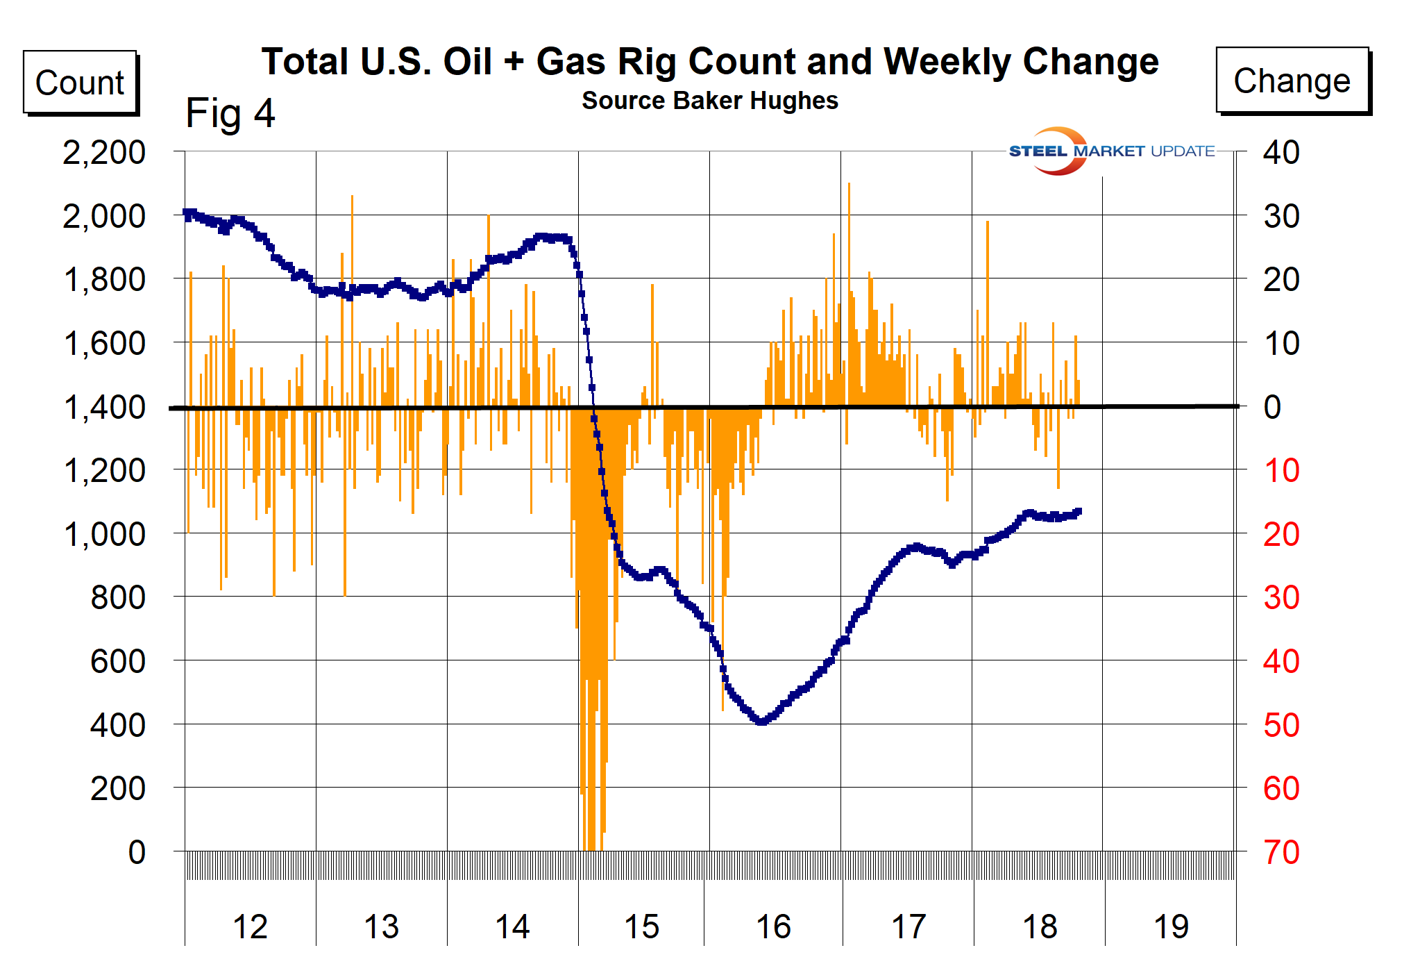
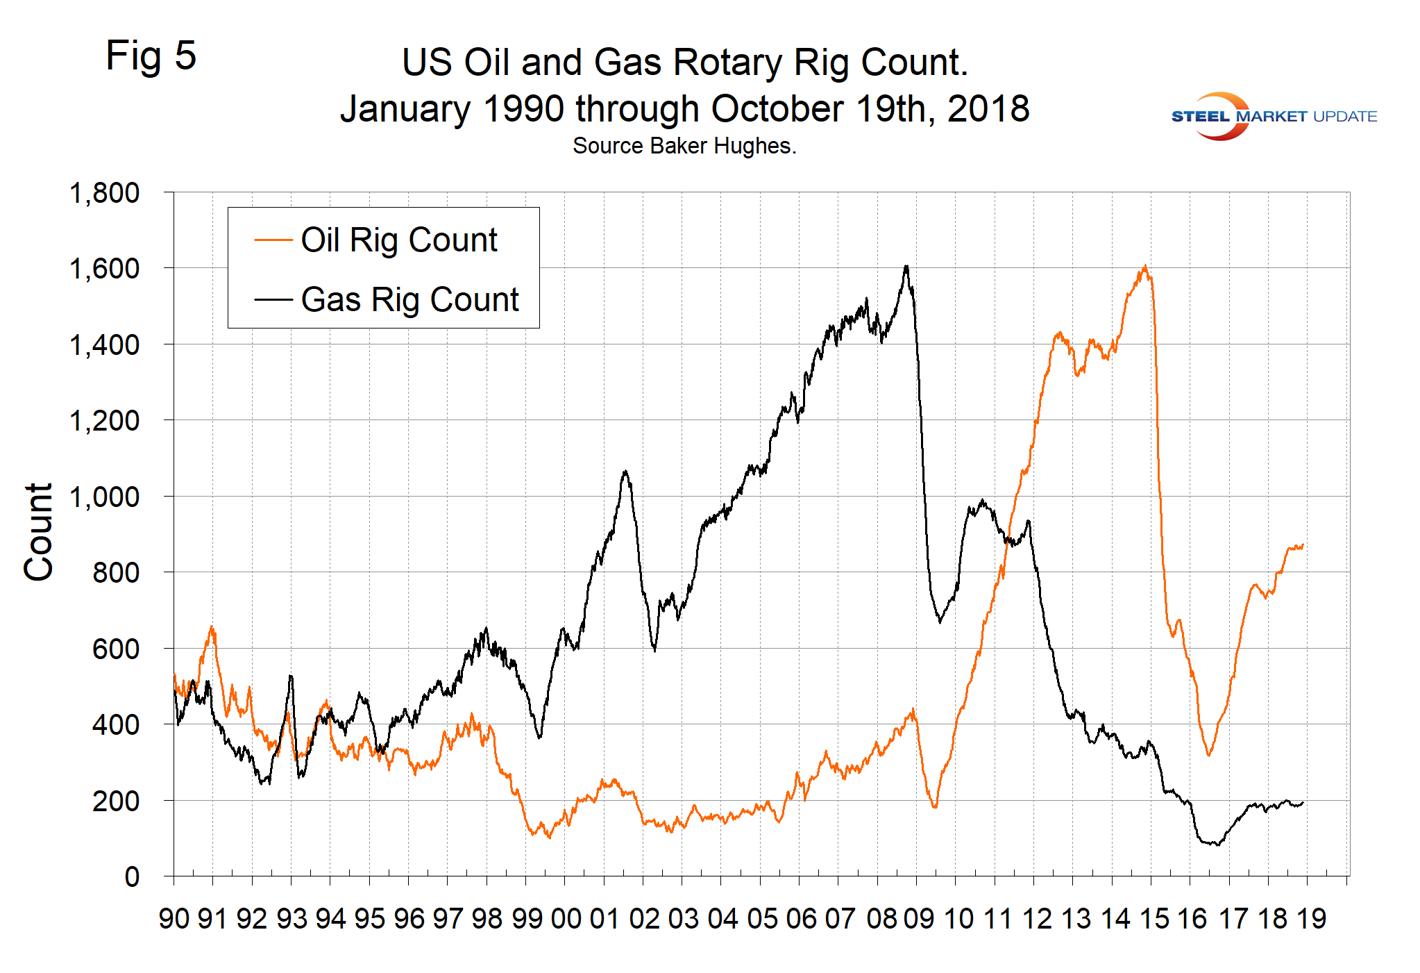
The oil rig count had a low point of 316 on June 27, 2016, and stood at 873 on Oct. 19, 2018. The count has increased by only 10 since May 15.
The U.S. gas rig count rose from its low point of 81 on Aug. 5, 2016, to 194 on Oct. 19. There has been zero increase in the gas rig count since March 29 this year. The year-over-year growth rate of total U.S. operating rigs was 16.9 percent in the latest data with oil up by 18.6 percent and gas up by 9.6 percent. Figure 5 shows the Baker Hughes U.S. Rotary Rig Counts for oil and gas equipment in the U.S. (explanation below).
On a regional basis in the U.S., the big three states for operating rigs are Texas, Oklahoma and North Dakota. Figure 6 shows the land rig count in those states since 2000.
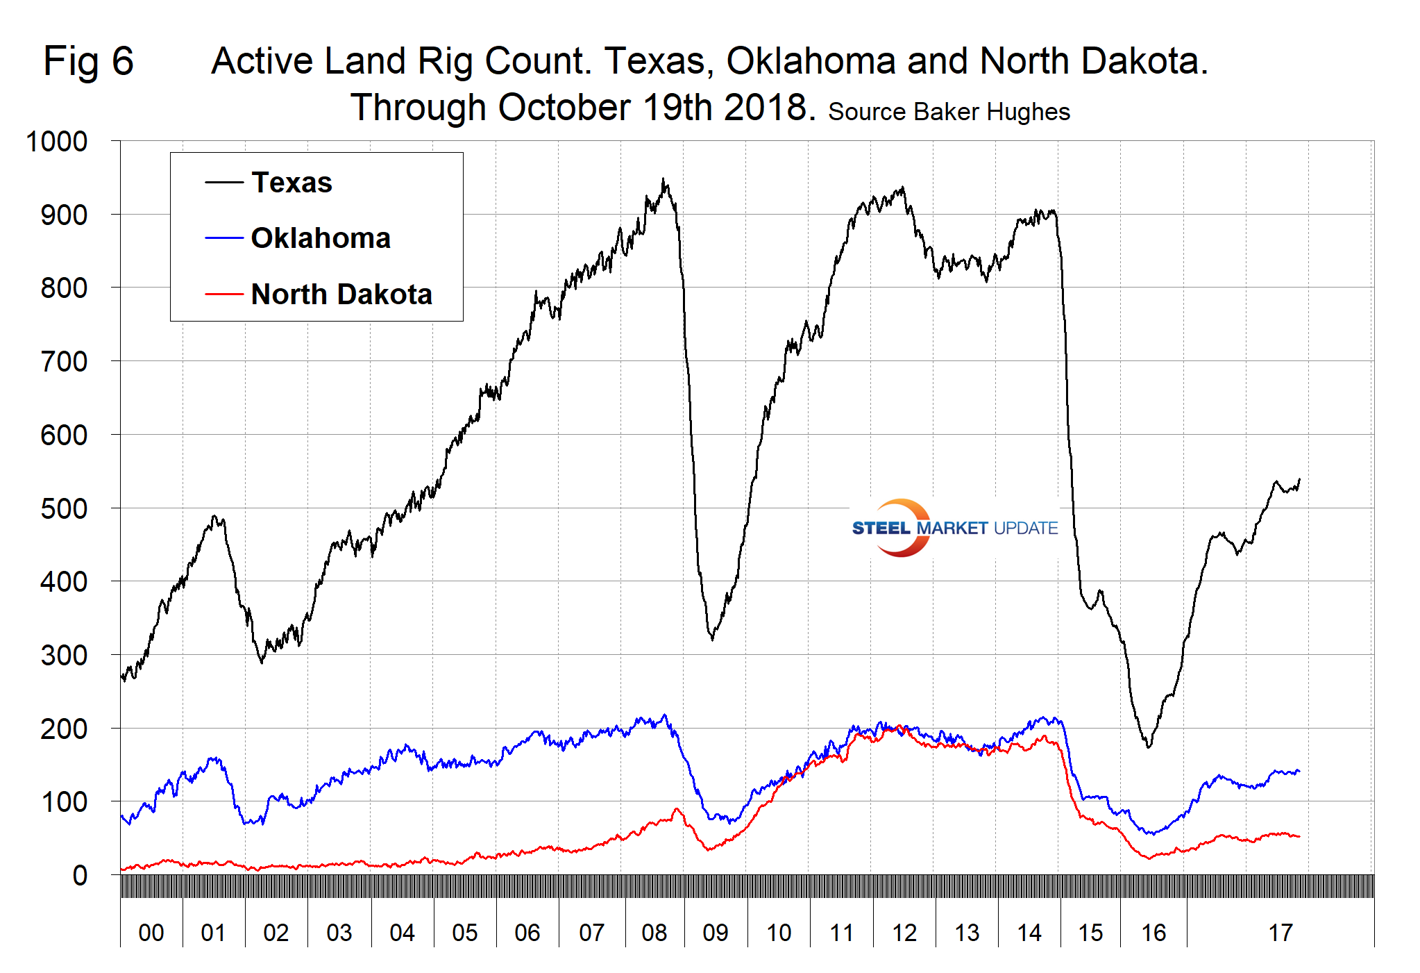
Figure 7 illustrates the monthly U.S. oilfield production of crude from January 1970 through July 2018 (latest data available) in thousands of barrels per month. The historical high was October 1970 at 310.4 million barrels. Production steadily declined to half that level in the late 2000s before the fracking revolution kicked into gear. December 2017 broke the record that had stood for 47 years with 310.7 million barrels produced, and July 2018 set a new record at 340 million barrels. EIA forecasts that U.S. crude oil production will average 10.7 million barrels per day in 2018, up from 9.4 million barrels in 2017, and will average 11.7 million barrels in 2019.
On Oct. 17, Scott Bauer of the CME Group wrote: “Alaskan oil production peaked in 1988 when Alaska accounted for 25 percent of U.S. domestic production; the state now produces only 7 percent of the U.S. total. Companies recently found massive untapped oil deposits in Alaska that could be accessible through fracking. Advances in new drilling technologies, incentive programs for accelerated permits from the state, and infrastructure investment make this basin ripe for exploration. It is estimated that fracked Alaskan oil could be profitable to drill at just $50 per barrel. The project calls for initial oil in 2021 with peak production of about 38,000 barrels daily by 2025.”
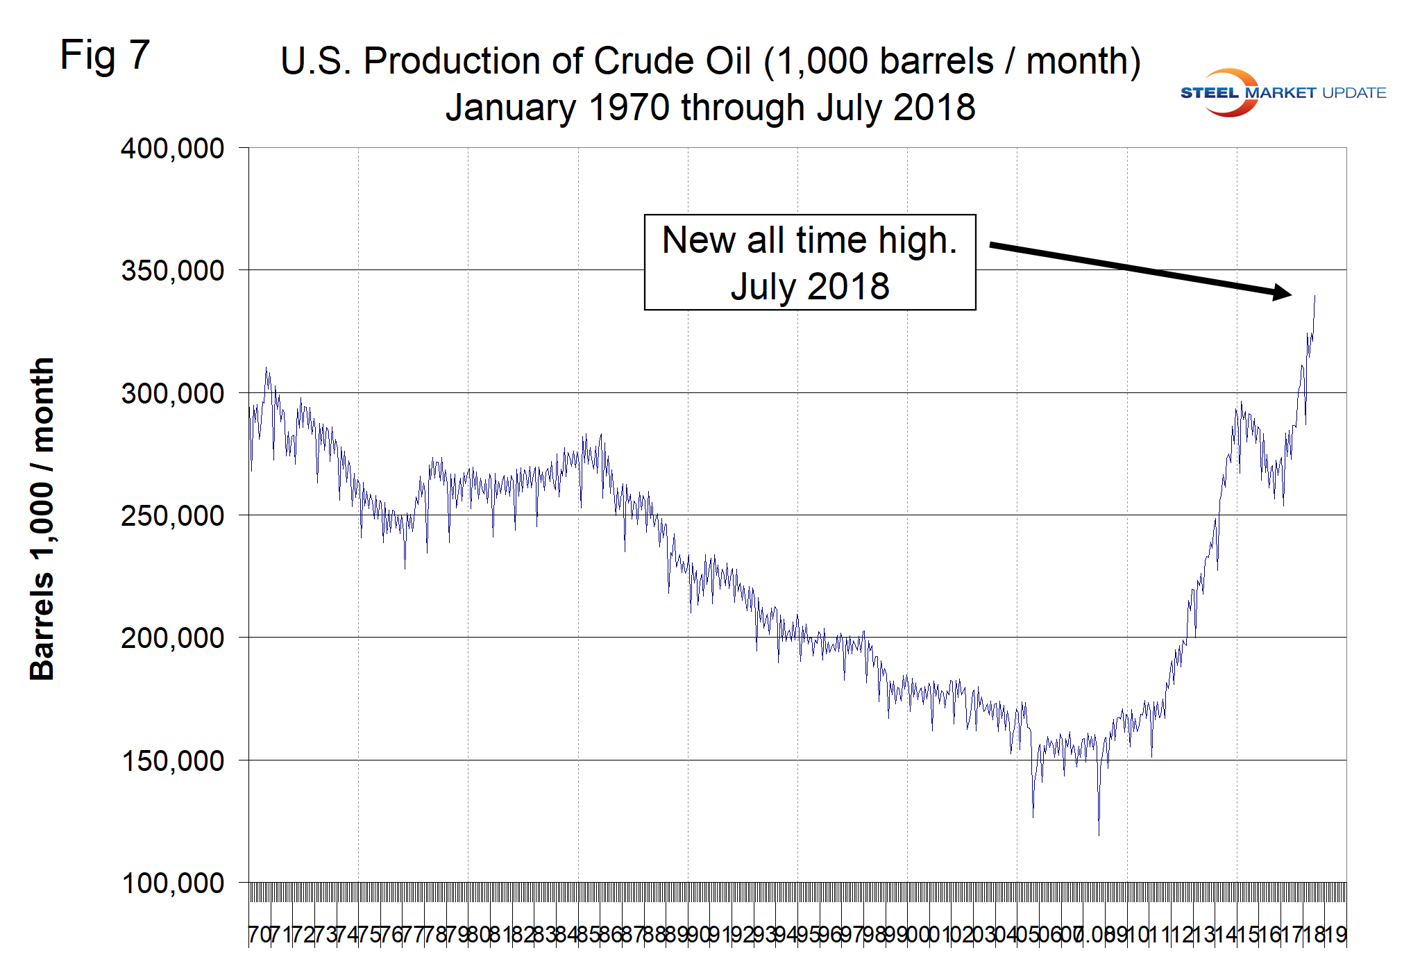
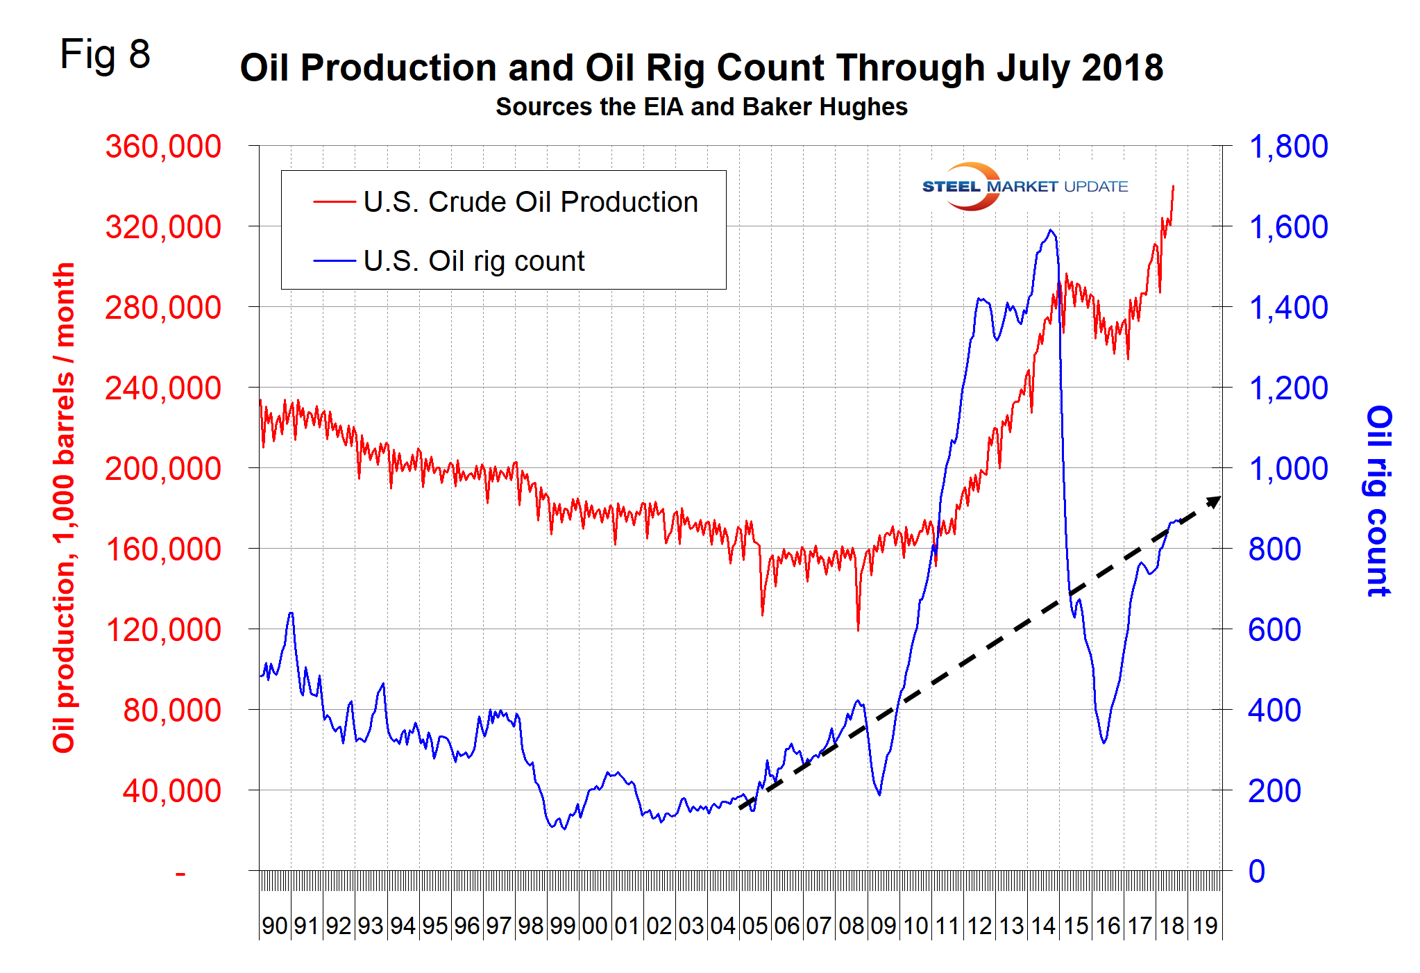
Figure 8 compares oil production and the oil rig count and shows how the increase in exploratory wells drove production from 2009 through late 2014 when the oil price collapsed. The subsequent decline in production was much less marked and is again increasing. Our take on this is that the huge increase in exploratory oil rigs beginning in 2009 may have been an anomaly and that we won’t see a repeat of the number operating in 2014 for a very long time.
Baker Hughes Rotary Rig Count: This is a weekly census of the number of drilling rigs actively exploring for or developing oil or natural gas in the United States. Rigs are considered active from the time they break ground until the time they reach their target depth and may be establishing a new well or sidetracking an existing one. The Baker Hughes Rotary Rig count includes only those rigs that are significant consumers of oilfield services and supplies.

