

Market Data

September 20, 2018
SMU Energy Analysis: Oil Output Up, Price Down
Written by Peter Wright
Oil production in the U.S. set another all-time record in August and stocks are increasing. In the last month, the price of oil has dropped by $16/barrel.
Wall Street Breakfast had this to say on Nov. 9: “Oil fell below the $60 level overnight, a day after slipping into a bear market. That means U.S. crude is now down by around 20 percent since early October as rising supply and concerns of an economic slowdown pressure prices. Fresh U.S. sanctions are unlikely to cut as much oil out of the market as initially expected with Washington granting temporary exemptions to Iran’s biggest buyers. American production has also reached a new record high of 11.6M bbl/day.”
Reuters reported on Wednesday, Nov. 14: “OPEC and its partners are discussing a proposal to cut oil output by 1.4 million barrels per day (bpd), three sources familiar with the issue said, although Russia may not be on board for such a large reduction. Worried by a drop in oil prices due to slowing demand and record supply from Saudi Arabia, Russia and the United States, the Organization of the Petroleum Exporting Countries is talking about a U-turn just months after increasing production.”
The spot price of West Texas Intermediate (WTI) FOB Cushing, Okla., had a recent peak on Oct. 3 of $76.40/barrel. By Nov.13, the price had declined to $55.63 and the rate was accelerating with a drop of $4.22 on the 13th. The total number of operating rigs exploring for oil and gas has only increased by 25 since June 15. The prices of oil and natural gas drive the consumption of energy-related steel products including oil country tubular goods, pipe fittings and well head equipment, among others. Welded tubular goods (not including OCTG) consumed about 5.5 million tons of hot rolled sheet in 2017.
Figure 1 shows historical oil and gas prices from January 2000 through Nov. 13, 2018. Our price and inventory data come from the Energy Information Administration (EIA). WTI was priced at $55.63 on the 13th; Brent crude was $65.45, realizing a differential of $9.82, which was the highest since July 27, 2015. EIA expects Brent spot prices to average $72 in 2019 and that West Texas Intermediate crude oil prices will average about $7 per barrel lower than Brent prices next year.
The price of natural gas at the Henry Hub in Louisiana has begun its winter escalation early this year. Gas closed at $3.58 on Nov. 11. On Nov. 14, HFI Energy wrote: “We said last Friday that the weather outlook turned bullish, which prompted us to close our short position. That is looking like the right move as the ECMWF-EPS outlook over the weekend turned even more bullish. November is looking really cold. Natural gas prices have been unrelenting as of the start of this week. With December contracts trading at $4.777/MMBtu, the psychological $4 barrier was easily broken.”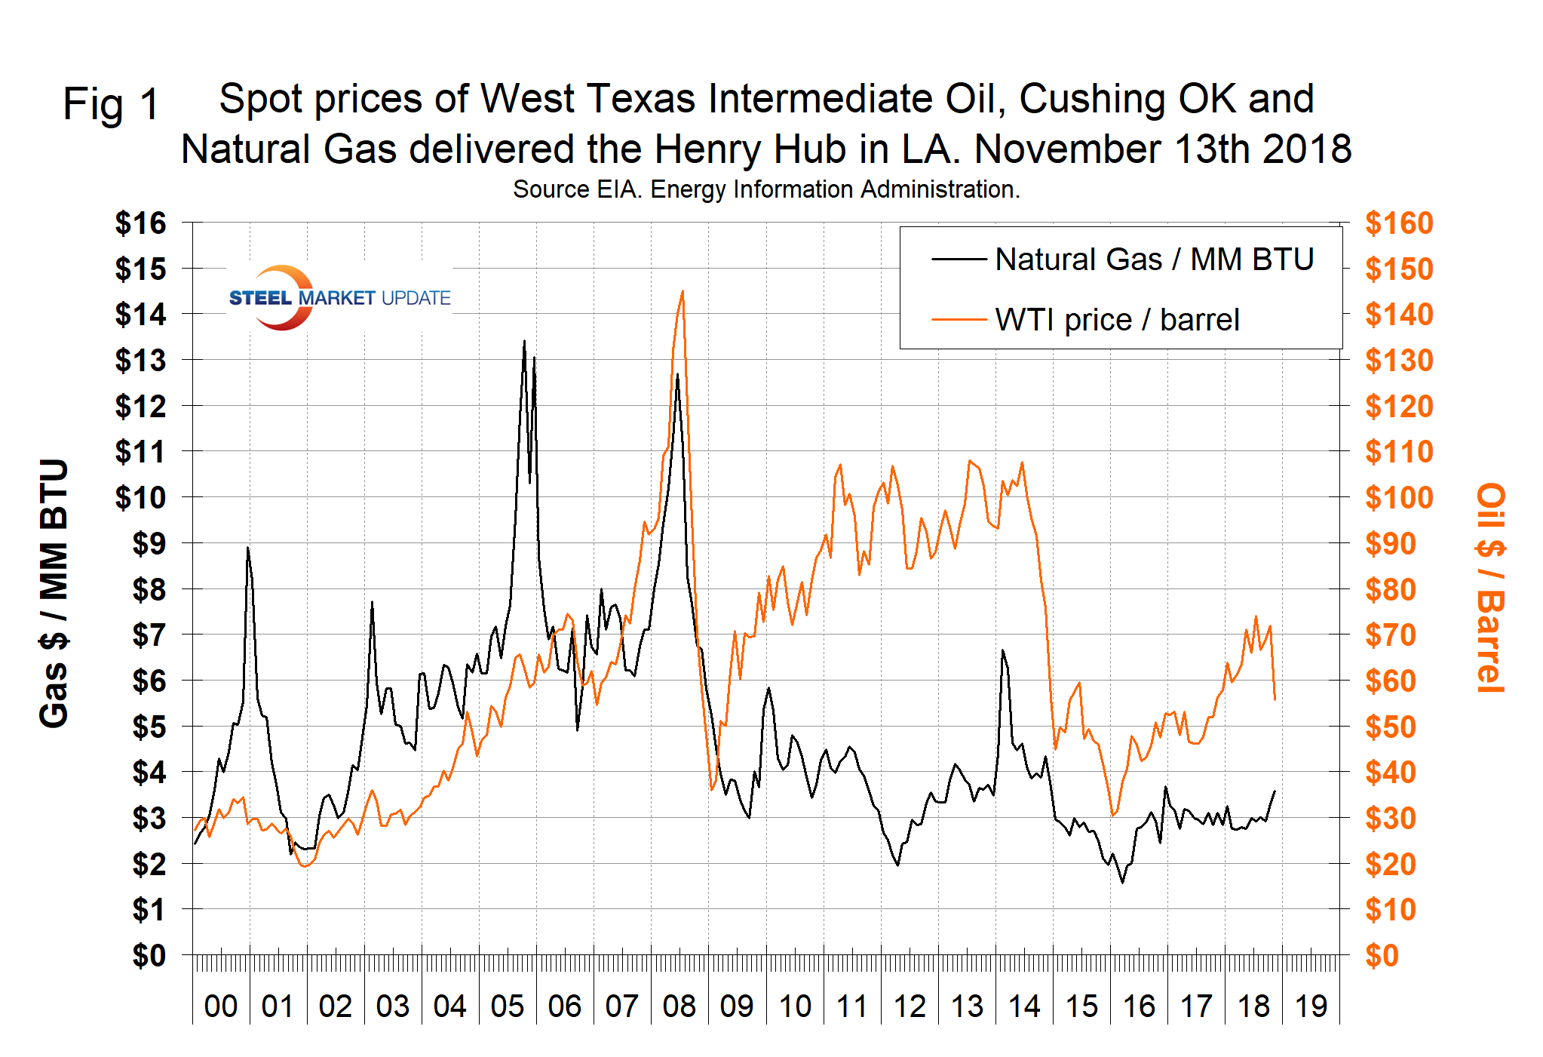
Stocks of crude oil in the U.S. have begun to increase after declining from May 25 through Sept. 14. In the last eight weeks, stocks have risen by over 41 million barrels. Figure 2 shows the inventory level, including the strategic petroleum reserve and the year-over-year change.
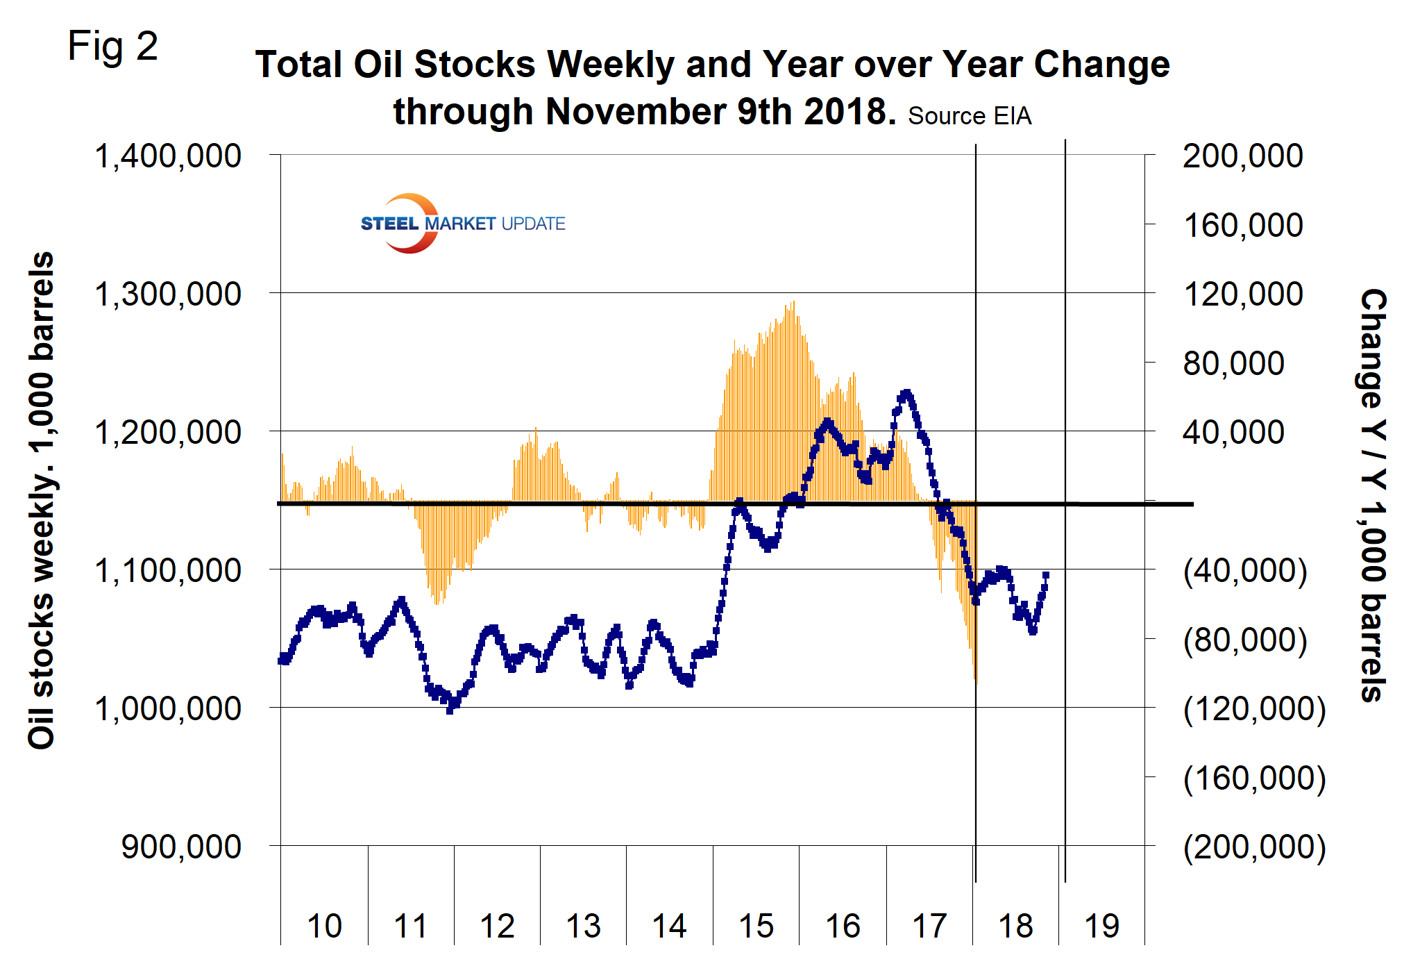
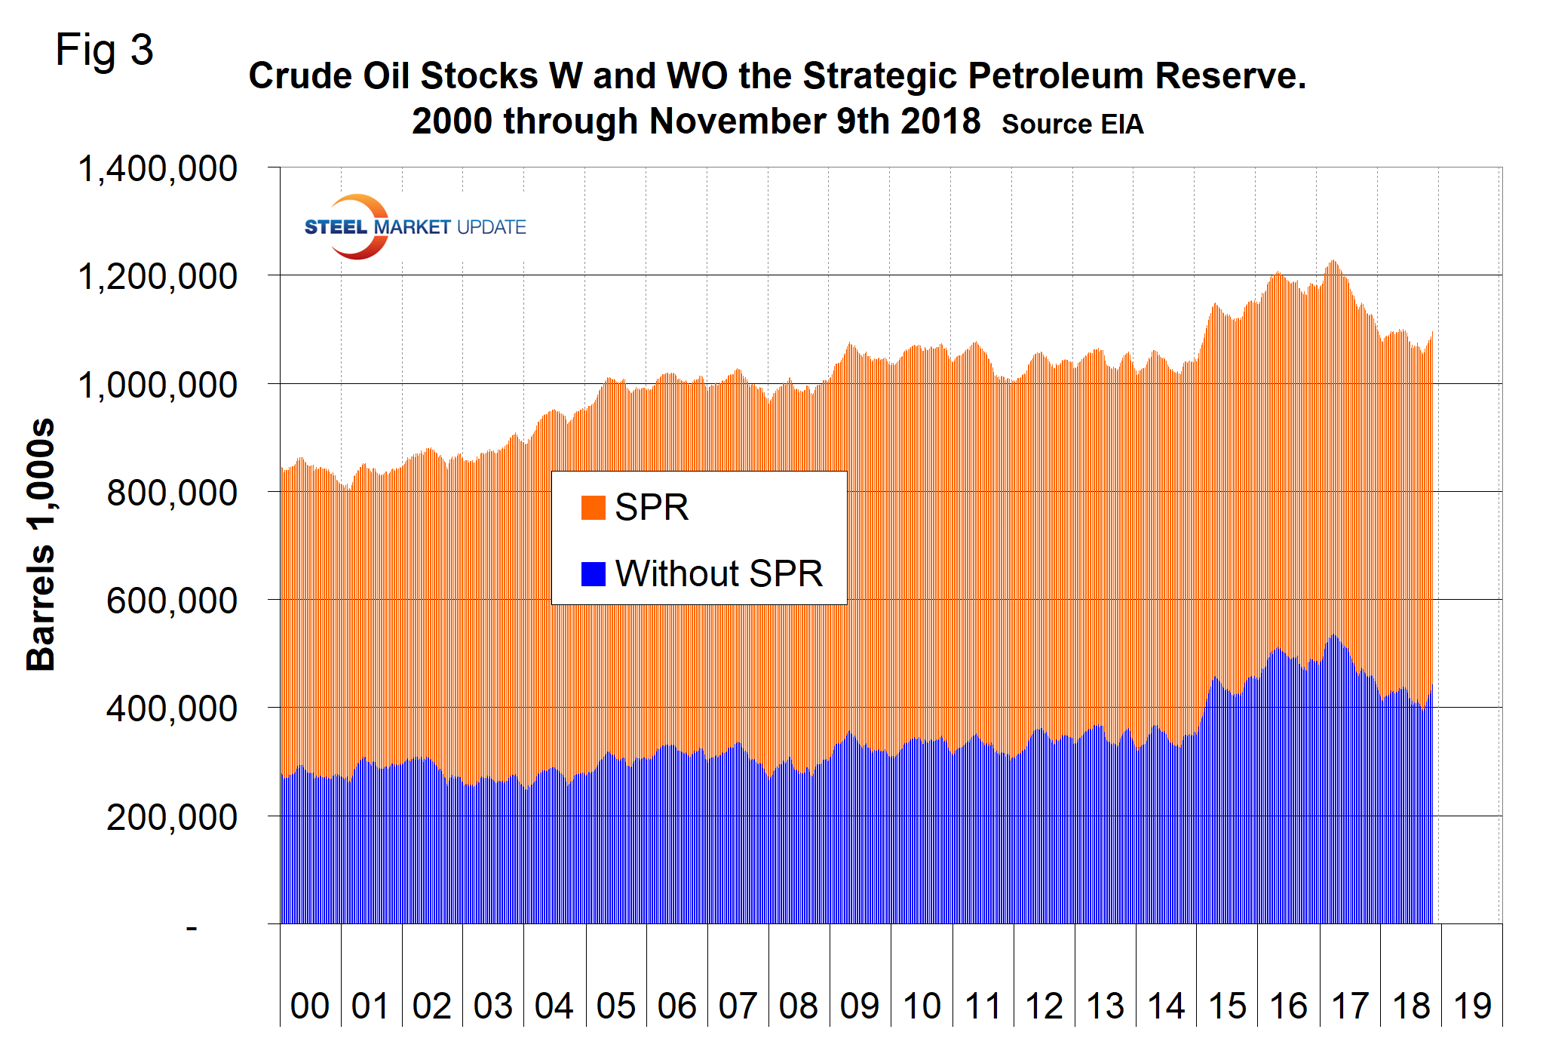
Figure 3 breaks total crude inventory into the working portion and the strategic petroleum reserve.
The total number of operating rigs in the U.S. on Nov. 16 was 1,082, up from 924 at the beginning of this year. The total number of operating rigs exploring for oil and gas has only increased by 25 since June 15. Figure 4 shows the total number of operating rigs in the U.S. and the weekly change.
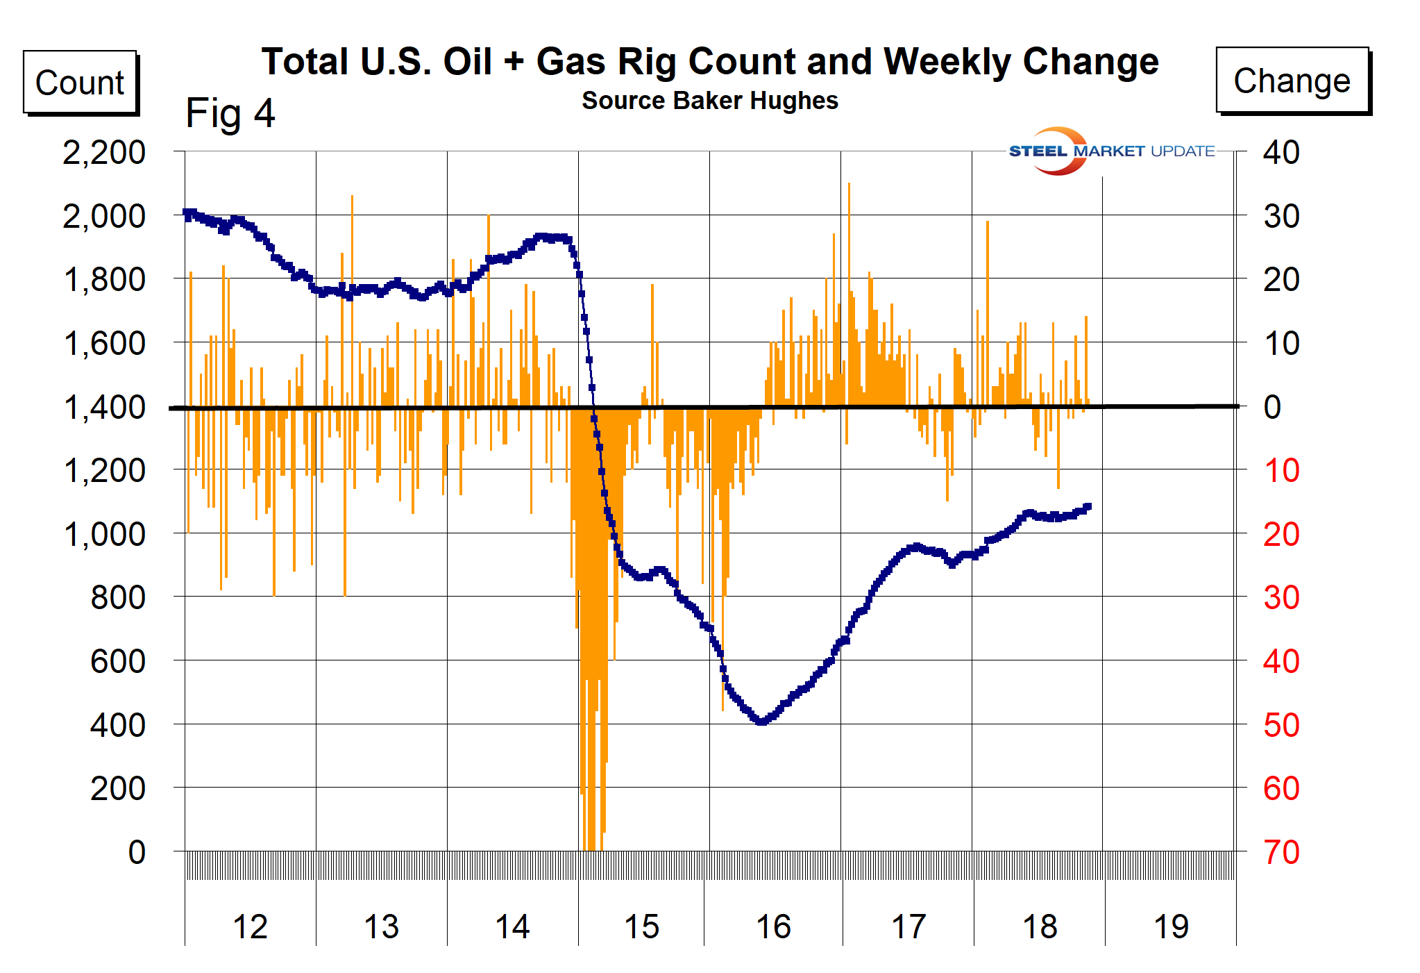
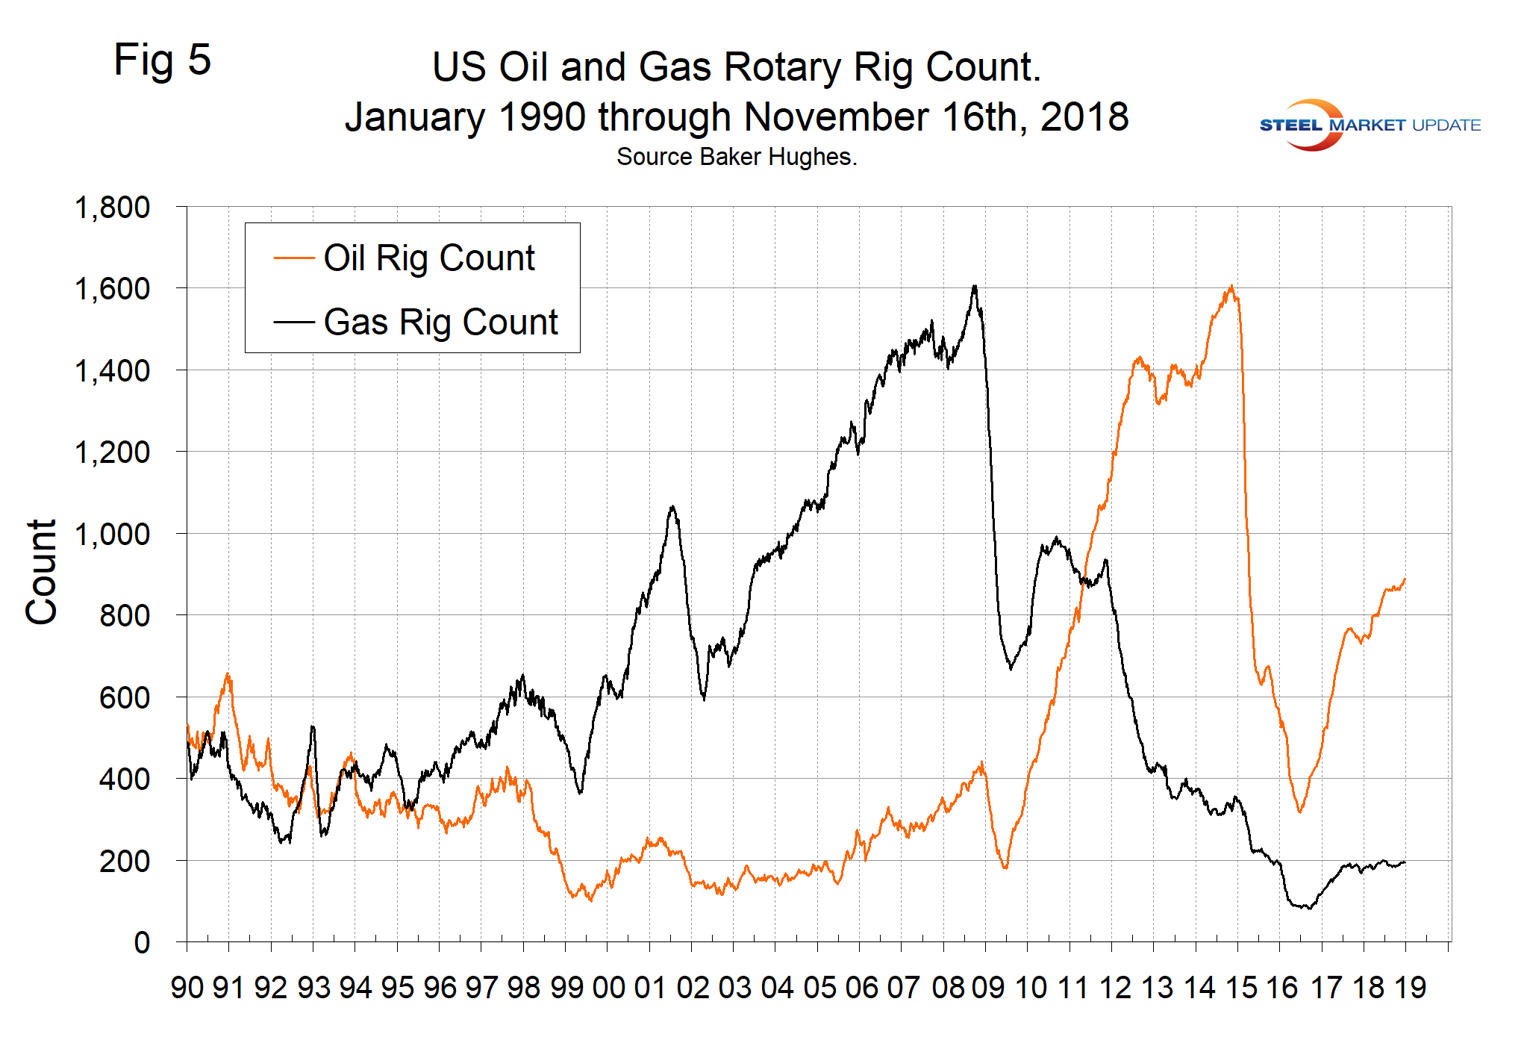
The oil rig count had a low point of 316 on June 27, 2016, and stood at 888 on Nov. 16, 2018. The count has increased by 146 so far in 2018.
The U.S. gas rig count rose from its low point of 81 on Aug. 5, 2016, to 194 on Nov. 16. There has been zero increase in the gas rig count since March 29 this year. The year-over-year growth rate of total U.S. operating rigs was 18.3 percent in the latest data with oil up by 20.3 percent and gas up by 9.6 percent. Figure 5 shows the Baker Hughes U.S. Rotary Rig Counts for oil and gas equipment in the U.S. (explanation below).
On a regional basis in the U.S., the big three states for operating rigs are Texas, Oklahoma and North Dakota. Figure 6 shows the land rig count in those states since 2000.
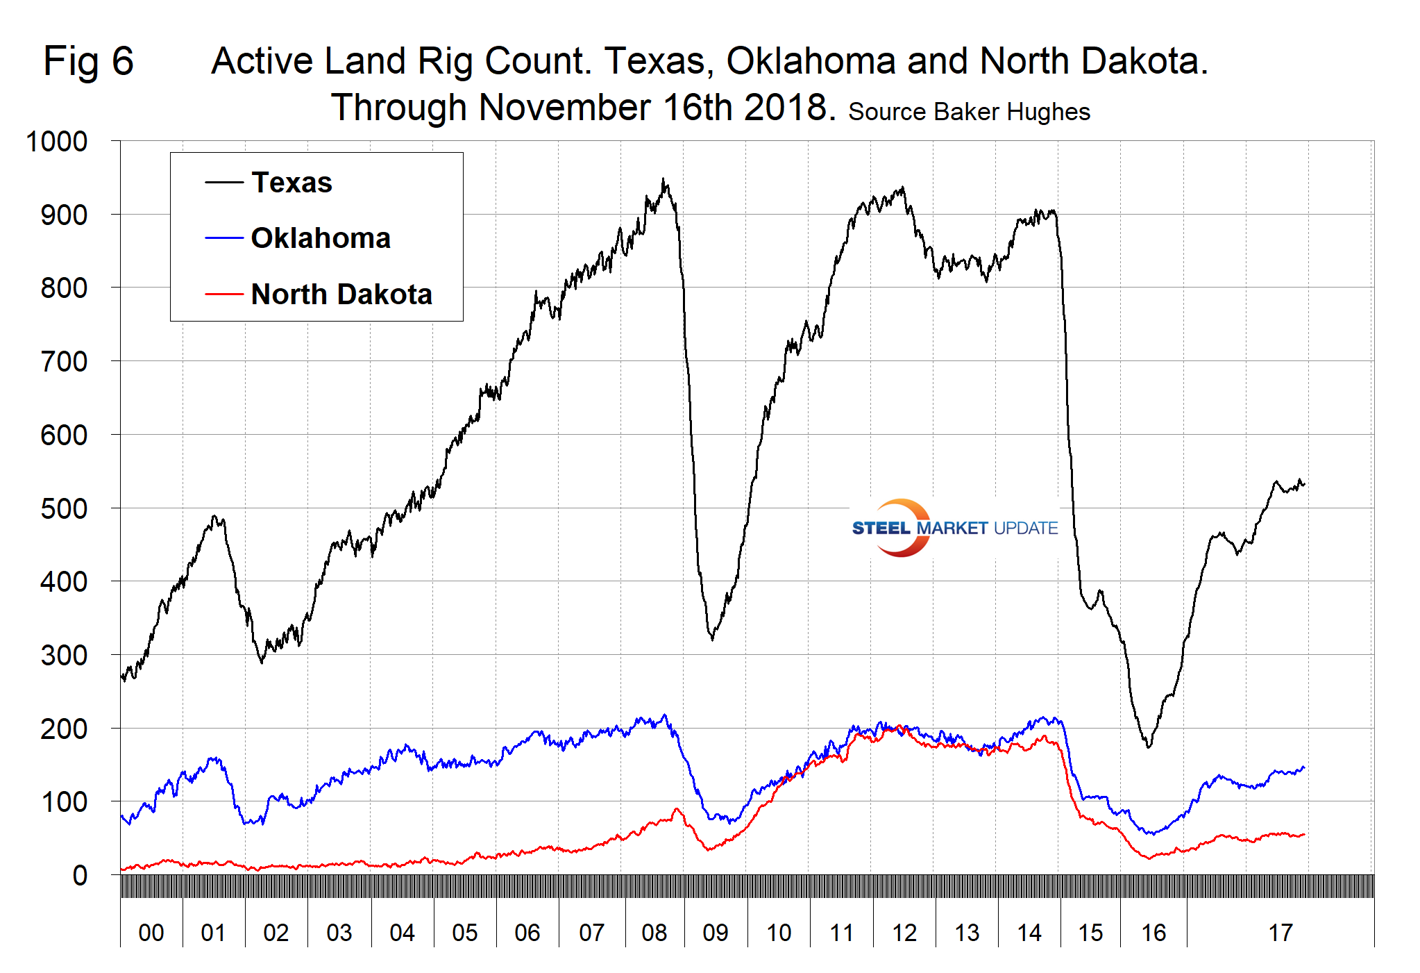
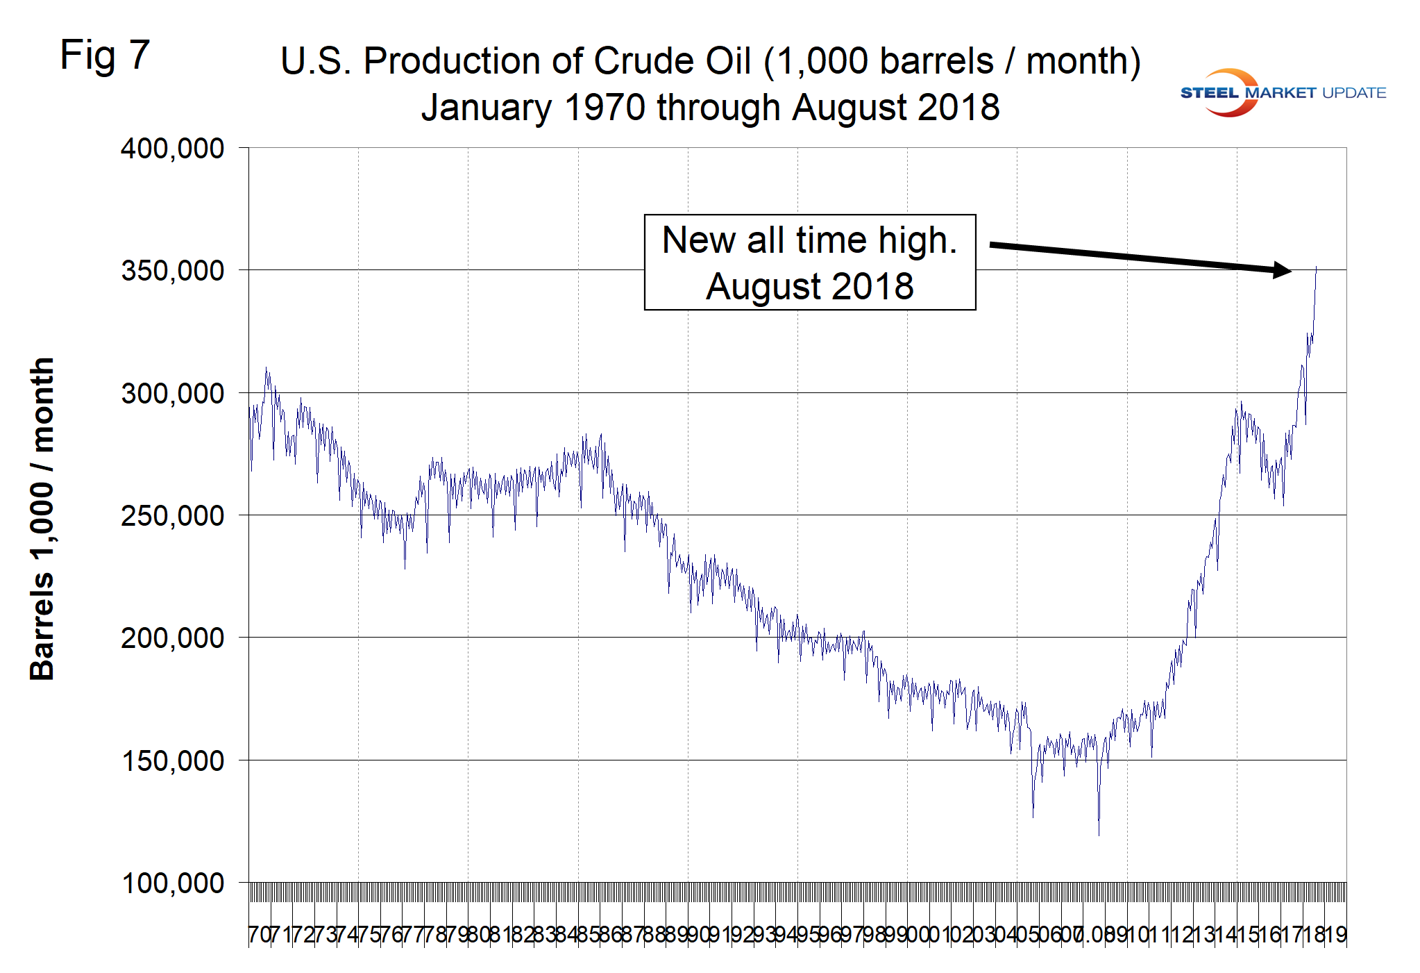
Figure 7 illustrates the monthly U.S. oilfield production of crude from January 1970 through August 2018 (latest data available) in thousands of barrels per month. The historical high was October 1970 at 310.4 million barrels. Production steadily declined to half that level in the late 2000s before the fracking revolution kicked in. December 2017 broke the record that had stood for 47 years with 310.7 million barrels produced, and August 2018 set a new record at 351.7 million barrels. EIA forecasts that U.S. crude oil production will average 10.7 million b/d in 2018, up from 9.4 million b/d in 2017, and will average 11.7 million b/d in 2019.
In its Nov. 6 short-term energy outlook, the EIA forecasts that dry natural gas production will average 83.2 Bcf/d in 2018, up 8.5 Bcf/d from 2017. Both the level and growth of natural gas production in 2018 would establish new records. EIA expects natural gas production will continue to rise in 2019 to an average of 89.6 Bcf/d.
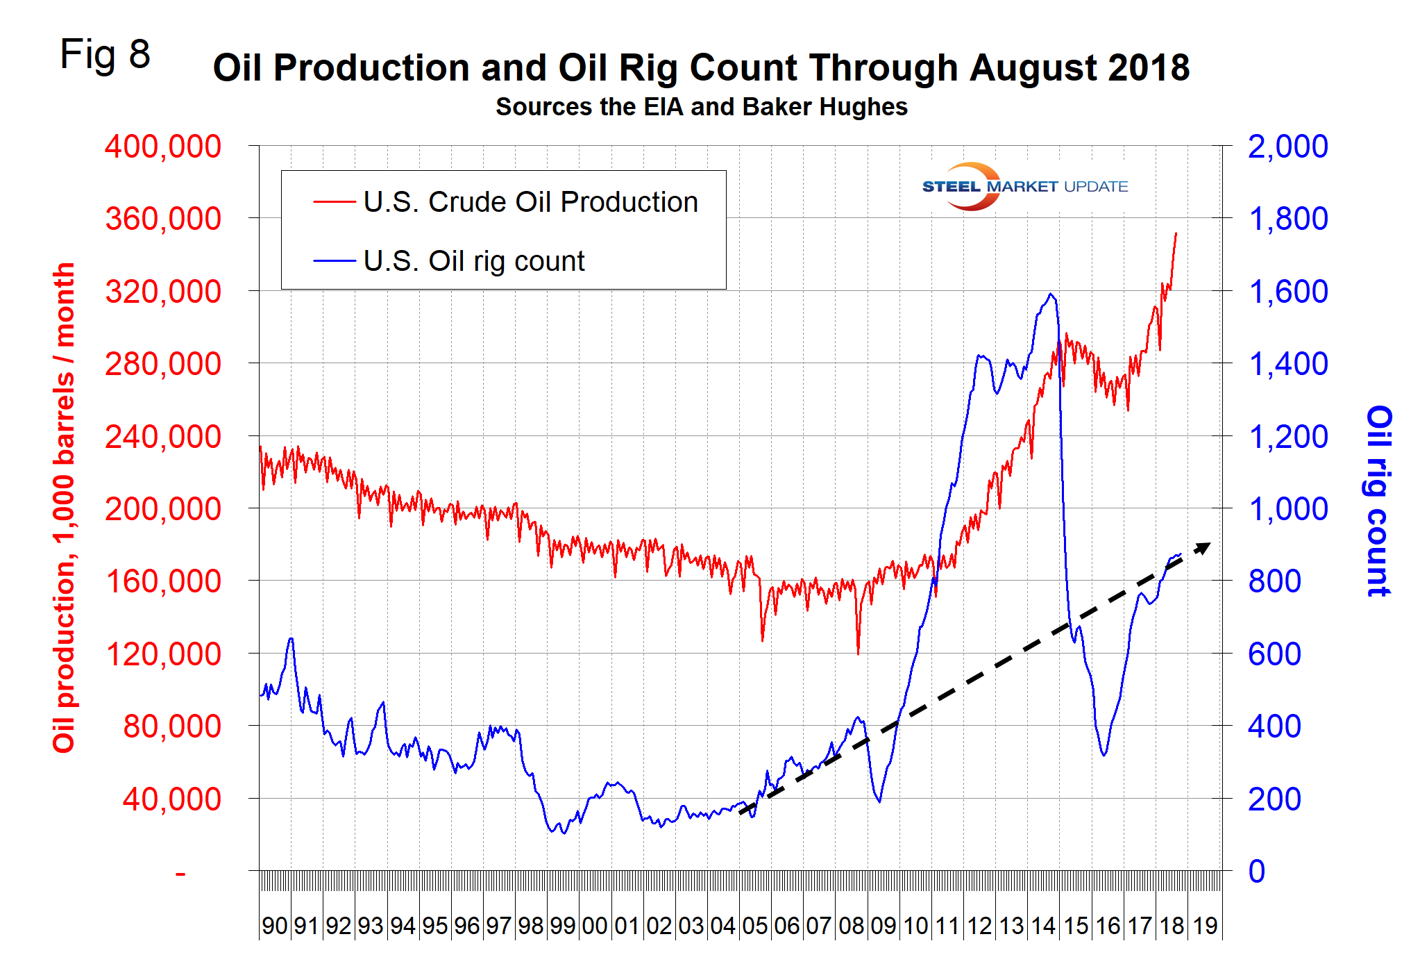
Figure 8 compares oil production and the oil rig count and shows how the increase in exploratory wells drove production from 2009 through late 2014 when the oil price collapsed. The subsequent decline in production was much less marked and is again setting new records. Our take on this is that the huge increase in exploratory oil rigs beginning in 2009 may have been an anomaly and that we won’t see a repeat of the number operating in 2014 for a very long time.
Baker Hughes Rotary Rig Count: This is a weekly census of the number of drilling rigs actively exploring for or developing oil or natural gas in the United States. Rigs are considered active from the time they break ground until the time they reach their target depth and may be establishing a new well or sidetracking an existing one. The Baker Hughes Rotary Rig count includes only those rigs that are significant consumers of oilfield services and supplies.