

Market Data

August 23, 2018
SMU Energy Analysis: Rig Count Up by Nearly 12 Percent
Written by Peter Wright
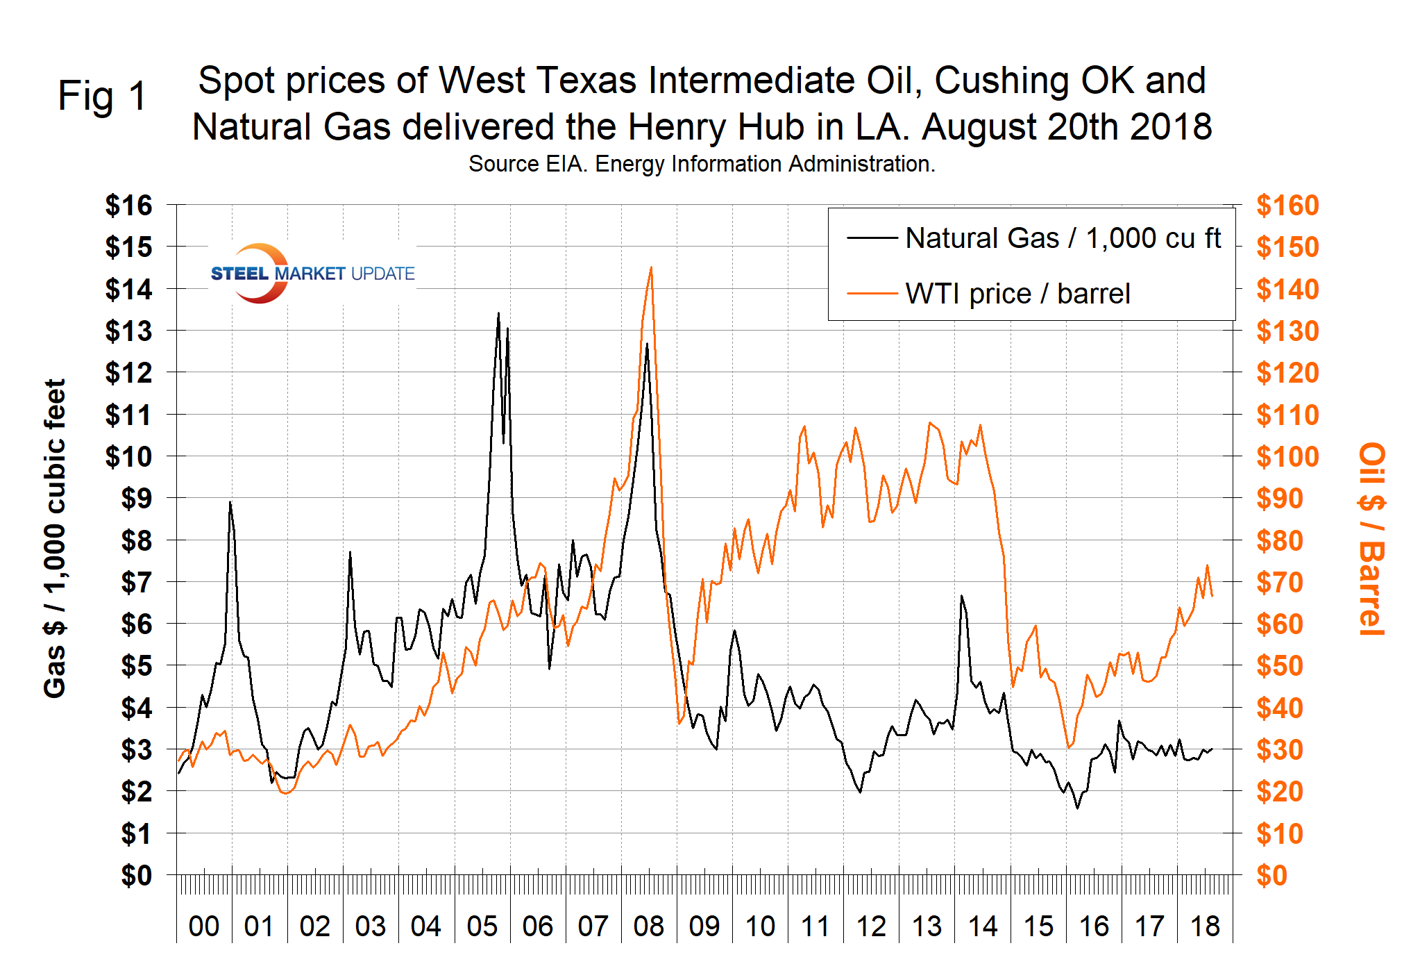
The spot price of West Texas Intermediate (WTI) has been erratic in the last four months with two brief spikes above $70 per barrel. The oil price was $66.50 on Aug. 20. The total number of operating rigs exploring for oil and gas was up by 11.7 percent year over year and increased by nine rigs in the first three weeks of August. The prices of oil and natural gas drive the consumption of energy-related steel products including oil country tubular goods, pipe fittings and well head equipment, among others. Welded tubular goods (not including OCTG) consumed about 5.5 million tons of hot rolled sheet in 2017.
Figure 1 shows historical oil and gas prices from January 2000 through Aug. 20, 2018. Price and inventory data come from the Energy Information Administration (EIA). Brent crude oil spot prices averaged $74 per barrel in July, largely unchanged from the average in June. EIA expects Brent spot prices to average $72 per barrel in 2018 and $71 per barrel in 2019 with WTI averaging about $6 per barrel lower than Brent prices in 2018 and in 2019.
The price of natural gas at the Henry Hub in Louisiana, except for a few short-lived spikes, has made no progress in two years. Gas closed at $3.00 on Aug. 17. EIA expects Henry Hub natural gas spot prices to average $2.96/million British thermal units (MMBtu) in 2018 and $3.10/MMBtu in 2019. EIA estimates dry natural gas production was 81.8 billion cubic feet per day (Bcf/d) in July, up 0.4 Bcf/d from June. EIA forecasts dry natural gas production will average 81.1 Bcf/d in 2018, up by 7.5 Bcf/d from 2017 and establishing a new record high. EIA expects natural gas production will rise again in 2019 to 84.1 Bcf/d.
The forecast for natural gas exports, which averaged 6.7 Bcf/d in 2017, will average 7.0 Bcf/d in 2018 and 8.5 Bcf/d in 2019. Increasing natural gas production in the United States and the completion of new pipelines that carry U.S. natural gas to demand centers in Mexico contributed to the expected increase. In June, two new pipelines in Mexico were placed in service that will distribute natural gas from the United States to destinations in Mexico. In addition, EIA forecasts exports of liquefied natural gas (LNG) to rise from 1.9 Bcf/d in 2017 to 3.0 Bcf/d in 2018 and to 5.1 Bcf/d in 2019. This growth contributes to U.S. net exports of natural gas averaging 2.0 Bcf/d in 2018 and 5.4 Bcf/d in 2019, compared with 0.3 Bcf/d in 2017.
Stocks of crude oil in the U.S. have declined by 13.0 percent since March 31 last year and are now lower than at any time since Jan. 23, 2015. Figure 2 shows the inventory level, including the strategic petroleum reserve and the year-over-year change.
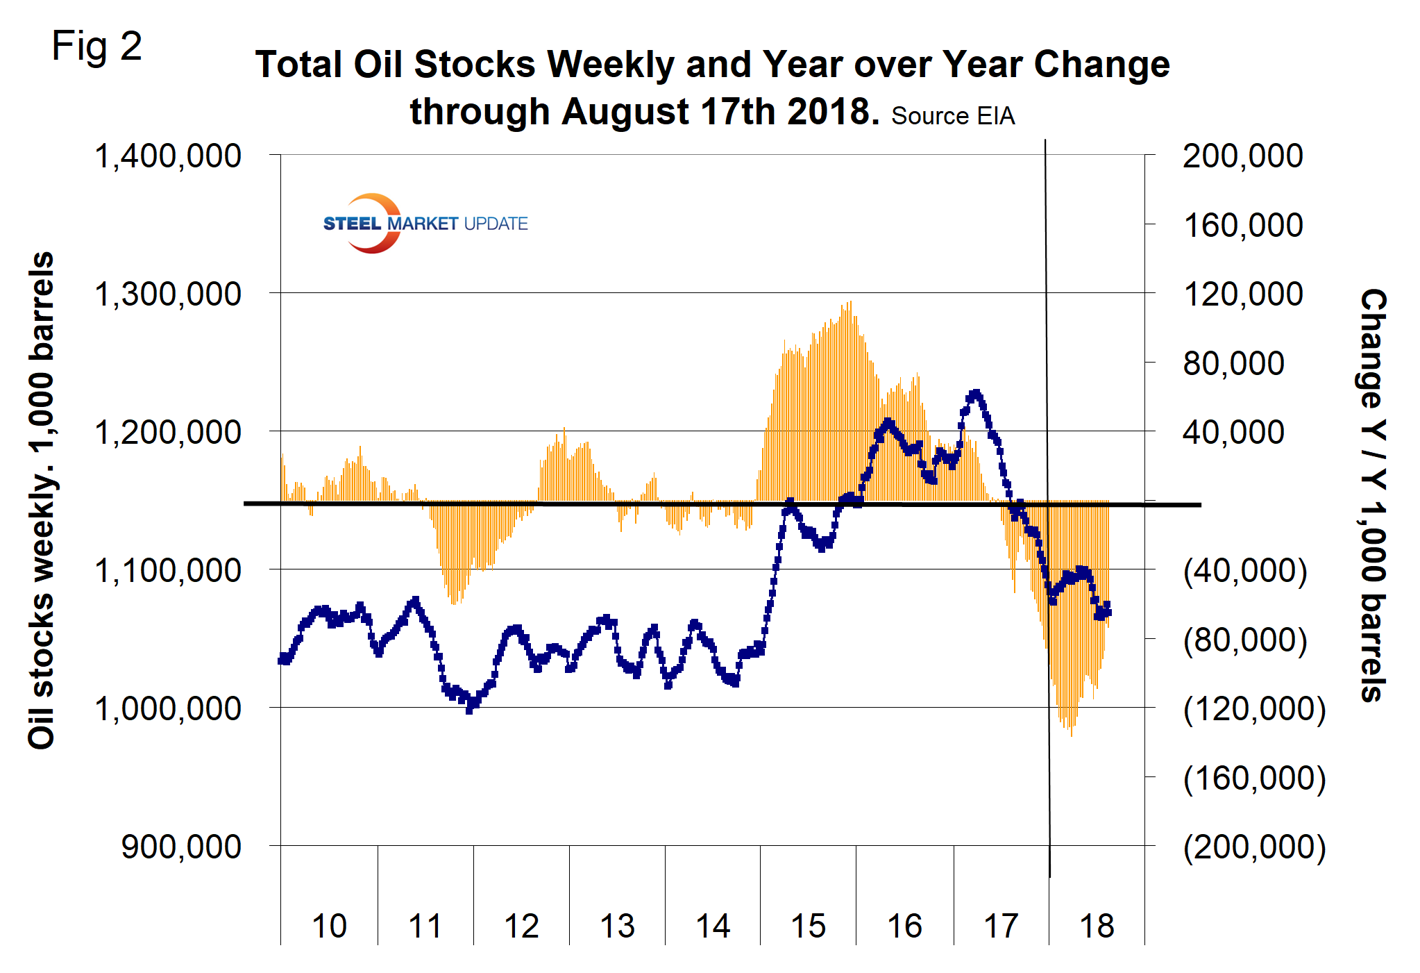
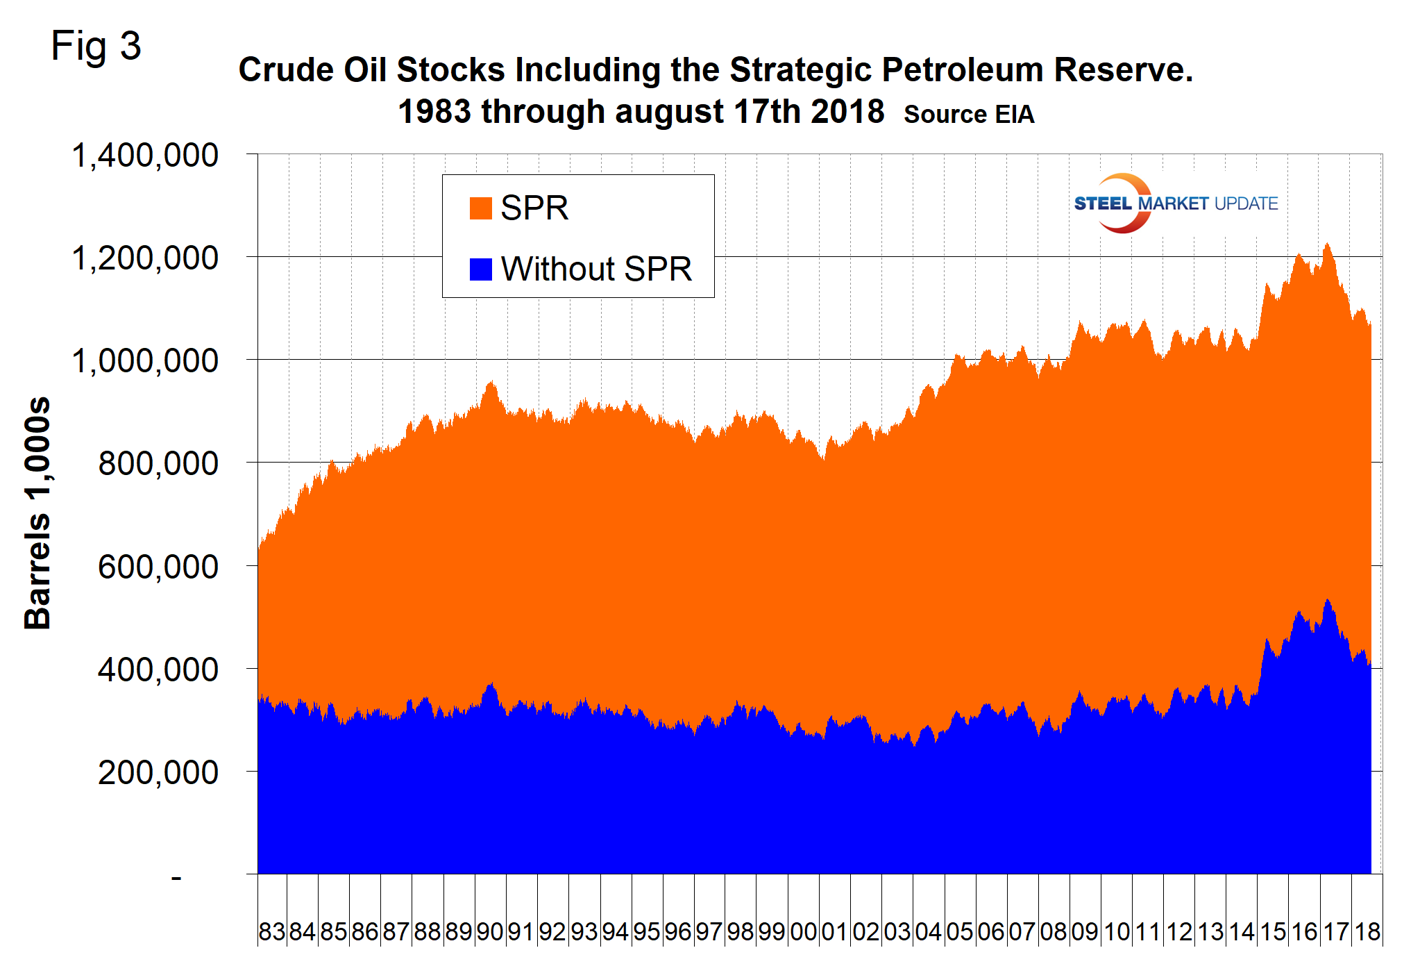
Figure 3 breaks total crude inventory into the working portion and the strategic petroleum reserve. Total inventories are down by 68 million barrels year over year.
The total number of operating rigs in the U.S. on Aug. 20 was 1,057, up from 924 at the beginning of this year. Figure 4 shows the total number of operating rigs in the U.S. and the weekly change.
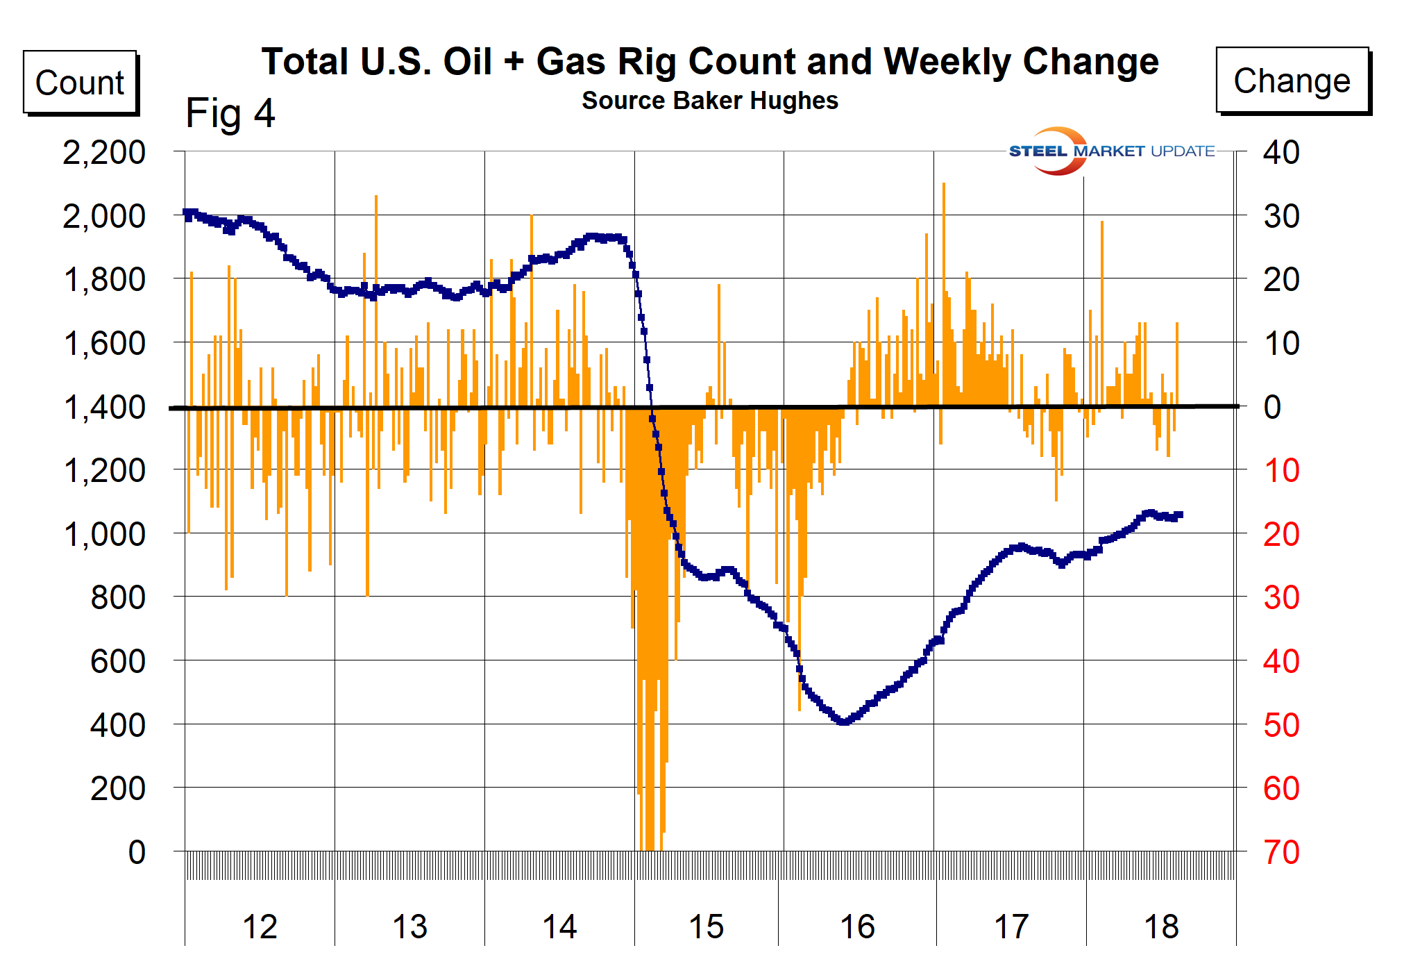
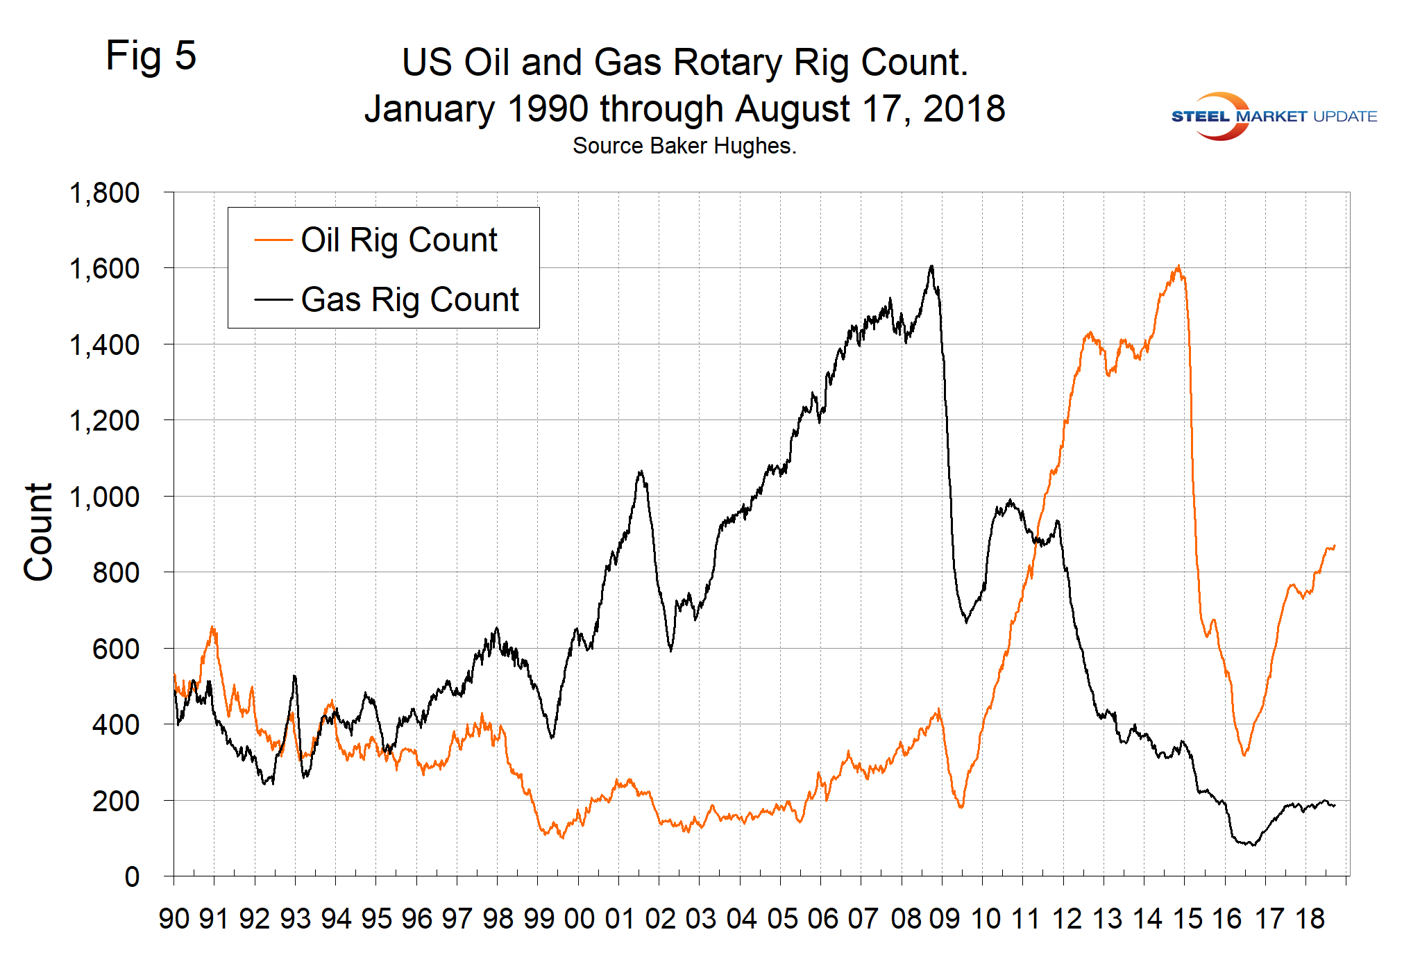
The oil rig count had a low point of 316 on June 27, 2016, and stood at 869 on Aug. 17, 2018. The U.S. gas rig count rose from its low point of 81 on Aug. 5, 2016, to 186 on Aug.17. The year-over-year growth rate of total U.S. operating rigs was 11.7 percent in the latest data with oil up by 13.9 percent and gas up by 2.2 percent. Figure 5 shows the Baker Hughes U.S. Rotary Rig Counts for oil and gas equipment in the U.S. (explanation below).
On a regional basis in the U.S., the big three states for operating rigs are Texas, Oklahoma and North Dakota. Figure 6 shows the land rig count in those states since 2000 and that non-conventional drilling in North Dakota has declined by 65 percent from its heyday in late 2014. This is not as bad as it sounds because previously drilled and capped wells are being put back on stream. In fact, the North Dakota active count has increased by 10 since the beginning of March.
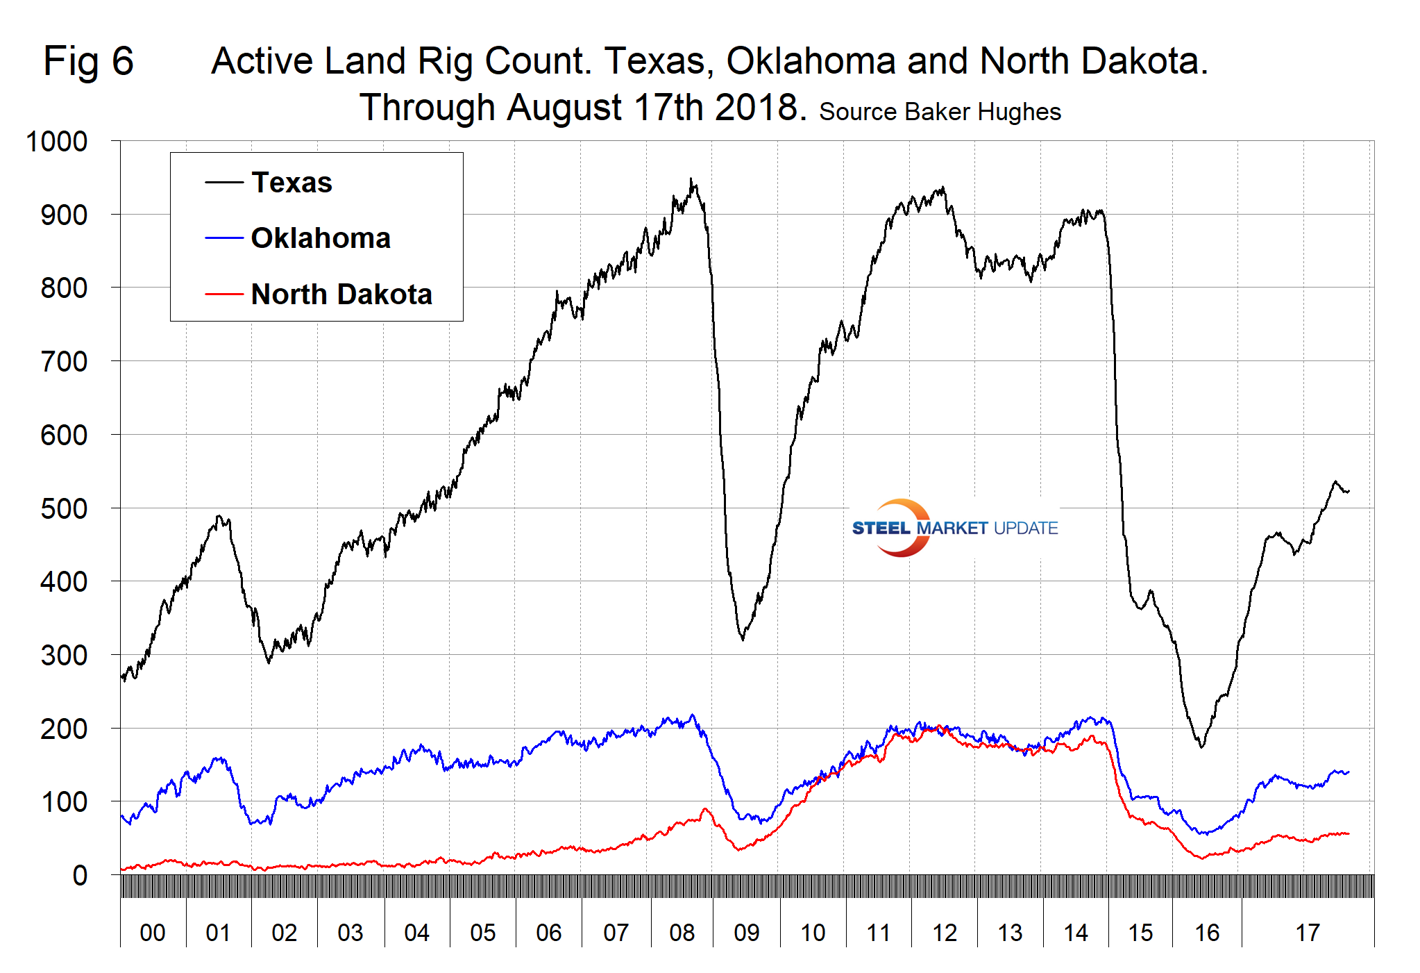
Figure 7 illustrates the monthly U.S. oilfield production of crude from January 1970 through May 2018 (latest data available) in thousands of barrels per month. The historical high was October 1970 at 310.4 million barrels. Production steadily declined to half that level in the late 2000s before the fracking revolution began. December 2017 broke the old record with 310.7 million barrels produced and March set a new record at 324.7 million barrels. April declined to 314.0 million barrels and May bounced back to 323.7 million. EIA’s preliminary estimate is that U.S. crude oil production averaged 10.8 million barrels per day in July, up 47,000 from June. EIA forecasts that U.S. crude oil production will average 10.7 million barrels per day in 2018, up from 9.4 million in 2017, and will average 11.7 million barrels per day in 2019.
On Aug. 17, Robert Boslego, an oil and gas portfolio analyst wrote: “Growth of crude production in the Permian Basin has been impressive over the past year. Estimated output in September 2018 is 3.421 million barrels per day (mmbd), an increase of 850,000 b/d, or 33 percent, year-over-year. As strong as that growth has been, ‘takeaway capacity’ problems have hampered even faster gains. Many more wells have been drilled than completed. According to Artem Abramov, vice president of shale analysis for Rystad Energy, the main relief to takeaway capacity constraints will come in second-half 2019 when 2 million barrels per day of pipeline capacity is expected to be added. The EIA has forecast that U.S. crude production will rise by one million barrels per day in 2019 to 11.7 mmbd. However, that increase may be far too conservative once Permian’s pipeline constraints are alleviated.”
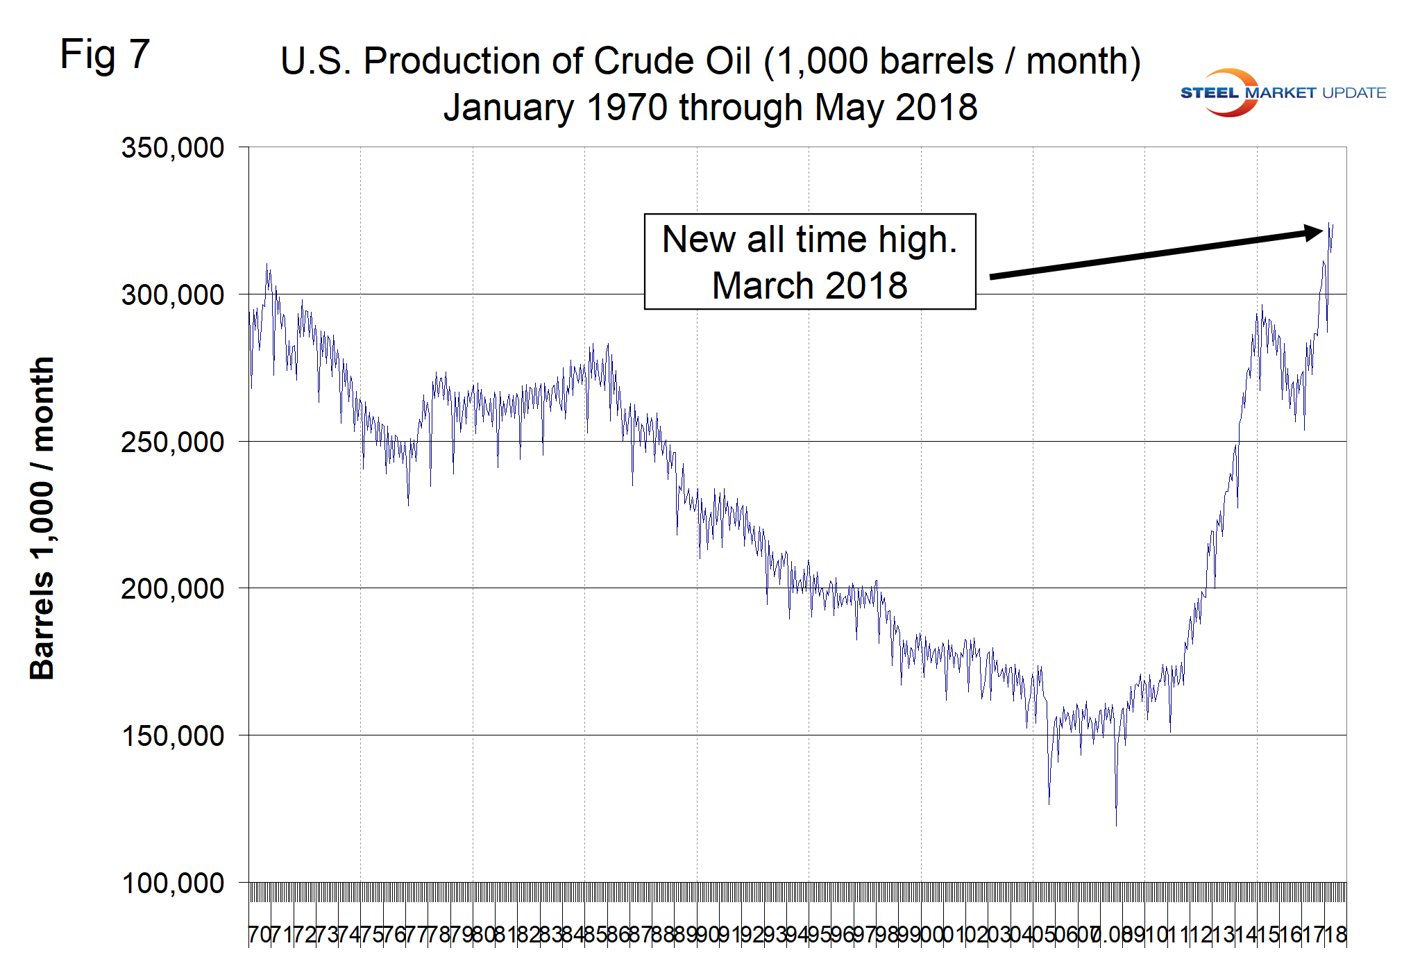
Figure 8 shows the location of the major shale producing regions in the U.S. including the Permian.
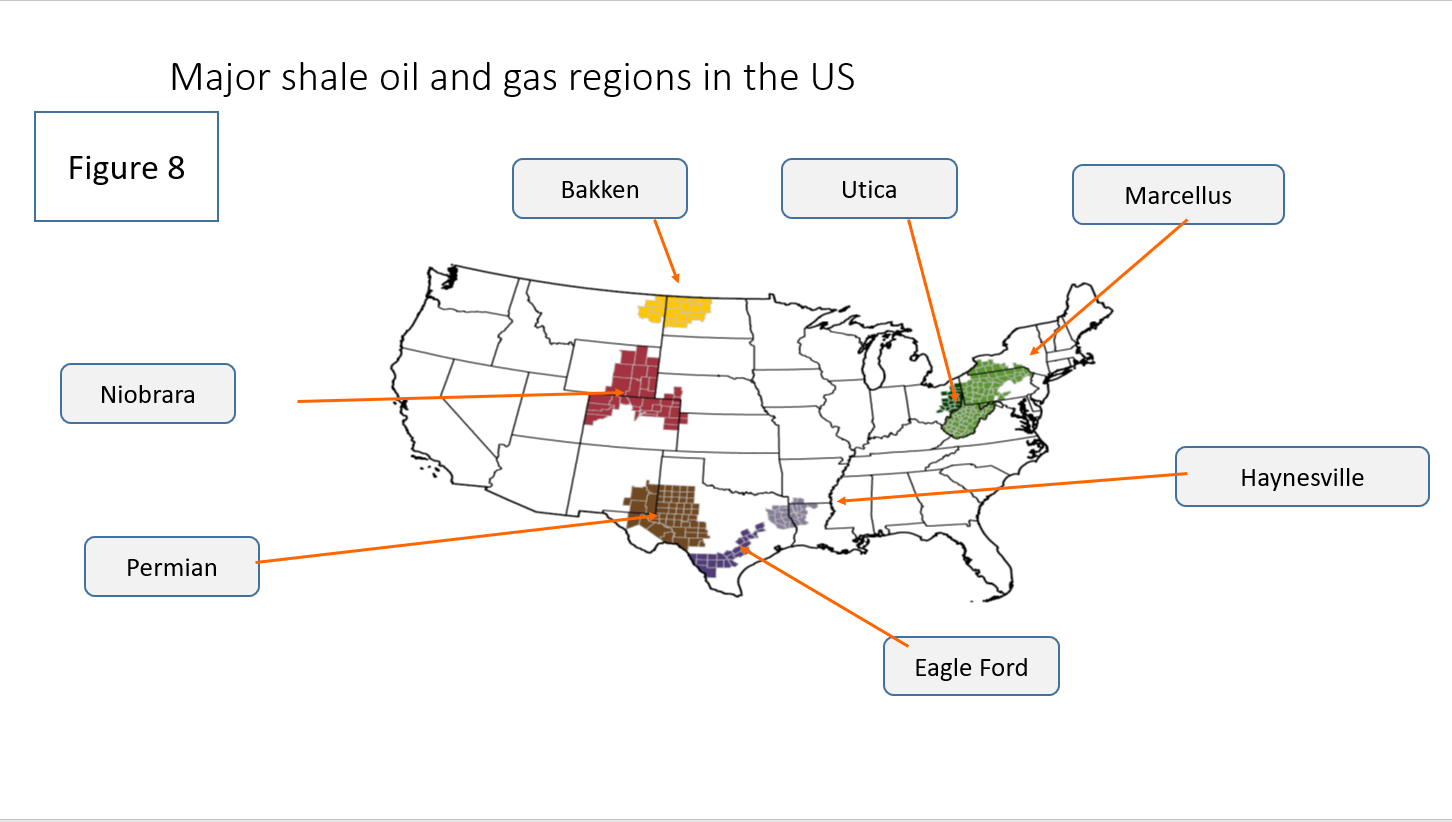
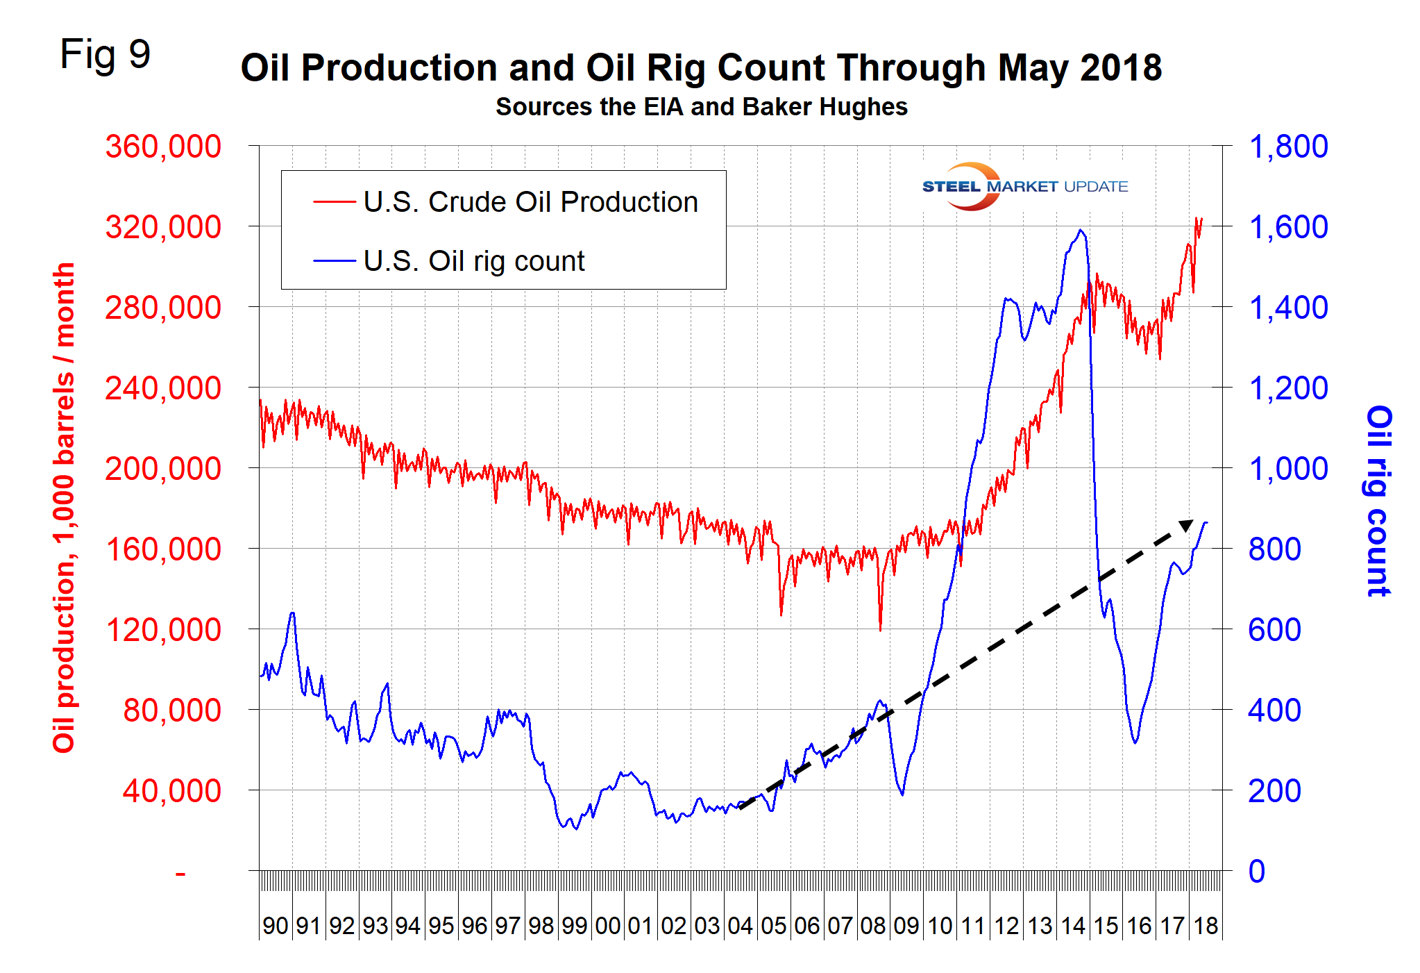
Figure 9 compares oil production and the oil rig count and shows how the increase in exploratory wells drove production from 2009 through late 2014 when the oil price collapsed. The subsequent decline in production was much less marked and is again increasing. Our take on this is that the huge increase in exploratory oil rigs beginning in 2009 may have been an anomaly and that we won’t see a repeat of the number operating in 2014 for a very long time.
Baker Hughes Rotary Rig Count: This is a weekly census of the number of drilling rigs actively exploring for or developing oil or natural gas in the United States. Rigs are considered active from the time they break ground until the time they reach their target depth and may be establishing a new well or sidetracking an existing one. The Baker Hughes Rotary Rig count includes only those rigs that are significant consumers of oilfield services and supplies.


