

Market Data

July 16, 2018
China’s Economy Slows, But Not Its Steel Production
Written by Peter Wright
Growth of China’s economy has flattened, but steel production continues to surge. Once each quarter, Steel Market Update publishes the official statistics for Chinese GDP, industrial production, consumer price inflation and fixed asset investment. Many analysts don’t believe these self-serving Party figures, but we include them in our reports because of the importance of China in the global steel scene, and these numbers are all that’s available. China’s economic statistics are never revised.
Figure 1 shows published data released this week for the growth of Chinese GDP, industrial production and consumer prices through second-quarter 2018. The GDP and industrial production portions of this graph are three-month moving averages (3MMAs).
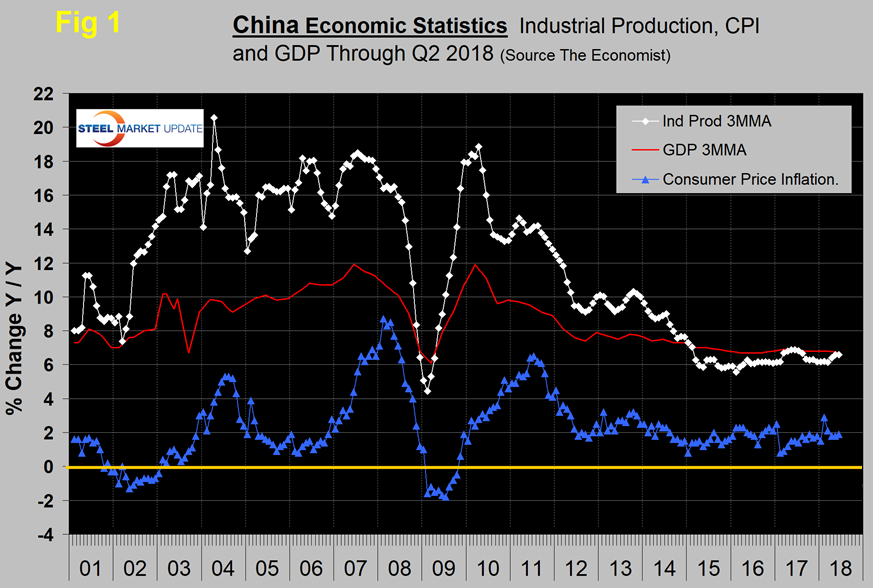
China’s GDP grew at a rate of 6.7 percent in the second quarter, which was down from 6.8 percent in the previous three quarters and very little changed for 12 quarters. The second-quarter result exceeded economists’ expectations. If as still anticipated the economy slows in the third quarter, the government may commit to further easing. The Shanghai composite has declined by over 15 percent this year and the yuan has declined against the currencies of major trading partners, including the U.S. Consumer price inflation remains below the official 2 percent target.
Growth of industrial production in China slowed from 6.8 percent in May to 6.0 percent in June, but the 3MMA was unchanged at 6.6 percent. It may be that the April and May results at 7.0 and 6.8 percent, respectively, were outliers because June returned to the March level. There has been a decline in sentiment across the Chinese economy as investors await the outcome of the reciprocal trade actions with the United States.
Figure 2 shows the growth of fixed asset investment year over year. In June, FAI grew at 6.0 percent, down from 7.9 percent in January. The slowdown has been partially driven by environmental restrictions and a reduction in new investment in heavy industries.
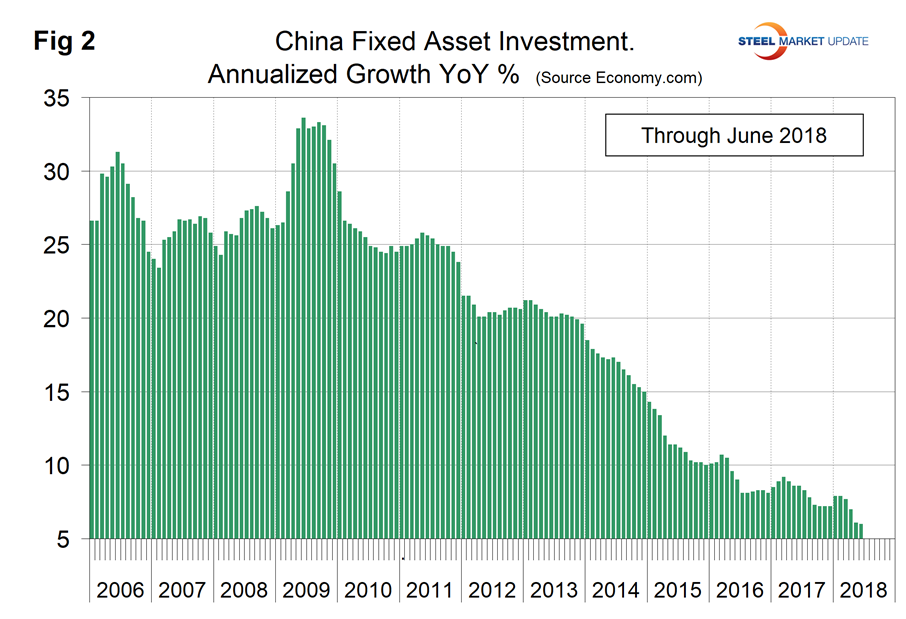
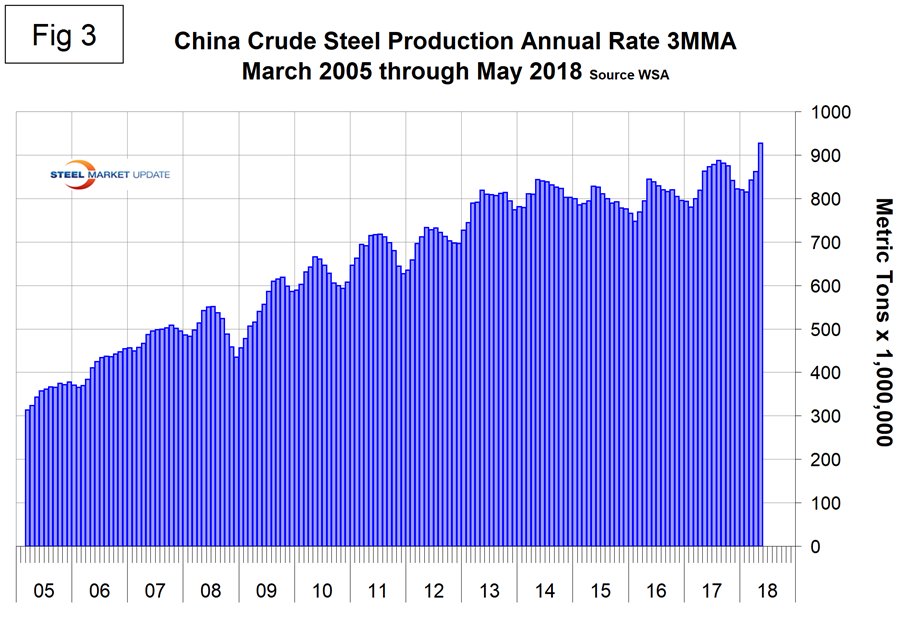
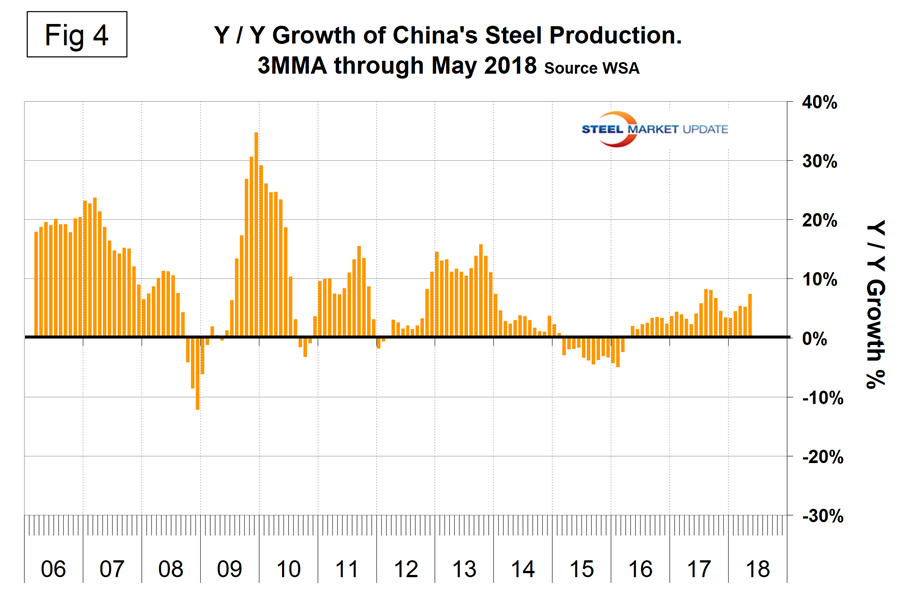
Figure 3 shows the 3MMA of China’s crude steel production through May when it accounted for 52.4 percent of global production. Figure 4 shows the year-over-year growth. After slowing for 13 straight months, China’s steel production returned to positive growth each month for the last two years. Preliminary results for June continued this trend with 7.5 percent growth. The central government continues to report that cutting overcapacity is high on its reform agenda. Excess capacity in sectors such as steel and coal has weighed on the country’s overall economic performance. Cutting capacity is not the same as cutting production, however.
SMU Comment: China’s steel production has continued to grow year over year confounding all the optimism about reductions. Capacity utilization is so low that it’s not a problem to cut capacity in polluted locations and to simultaneously increase production overall. In the four months February through May, the growth rate of China’s steel production exceeded that of the rest of the world.


