

Market Data

July 13, 2018
Census Data Shows Healthy Shipments-to-Inventories Ratio
Written by Peter Wright
Steel shipments and inventories are increasing as the inventory-to-shipment ratio is decreasing, while new orders have exceeded shipments each month in 2018, indicating a healthy product turnover, according to Steel Market Update’s latest analysis of Census Bureau data.
This is the third writeup of an analysis we began this year in which we investigate an alternative data source for steel product shipments. The Census Bureau provides monthly data on manufacturing inventories, shipments and new orders for total U.S. manufacturing, as well as for individual industries, one of which is steel products. Total shipments and inventories are reported in millions of dollars, seasonally adjusted. It seems to us that this data is much more credible than that available from the industry associations.
![]() Results for May were released on July 3. Figure 1 shows monthly steel shipments in millions of dollars since 1992 with the year-over-year growth. Shipments are up by 15.2 percent year over year and by 33.4 percent since January 2016. However, they are still not back to the level of 2011 through 2014. Year-over-year growth has been in double digits since February 2017 as shown by the brown bars in Figure 1. The Census Bureau defines shipments as follows: “Manufacturers’ shipments measure the dollar value of products sold by manufacturing establishments and are based on net selling values, f.o.b. (free on board) plant, after discounts and allowances are excluded. Freight charges and excise taxes are excluded. Multi-industry companies report value information for each industry category as if it were a separate economic unit. Thus, products transferred from one plant to another are valued at their full economic value.”
Results for May were released on July 3. Figure 1 shows monthly steel shipments in millions of dollars since 1992 with the year-over-year growth. Shipments are up by 15.2 percent year over year and by 33.4 percent since January 2016. However, they are still not back to the level of 2011 through 2014. Year-over-year growth has been in double digits since February 2017 as shown by the brown bars in Figure 1. The Census Bureau defines shipments as follows: “Manufacturers’ shipments measure the dollar value of products sold by manufacturing establishments and are based on net selling values, f.o.b. (free on board) plant, after discounts and allowances are excluded. Freight charges and excise taxes are excluded. Multi-industry companies report value information for each industry category as if it were a separate economic unit. Thus, products transferred from one plant to another are valued at their full economic value.”
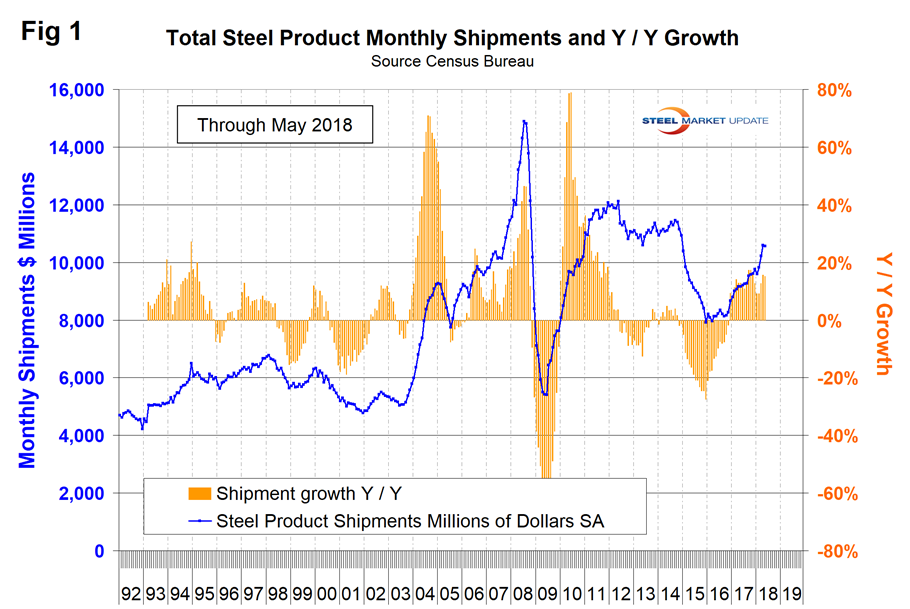
Figure 2 shows shipments and new orders on a monthly basis for all steel products. New orders have exceeded shipments every month in 2018.
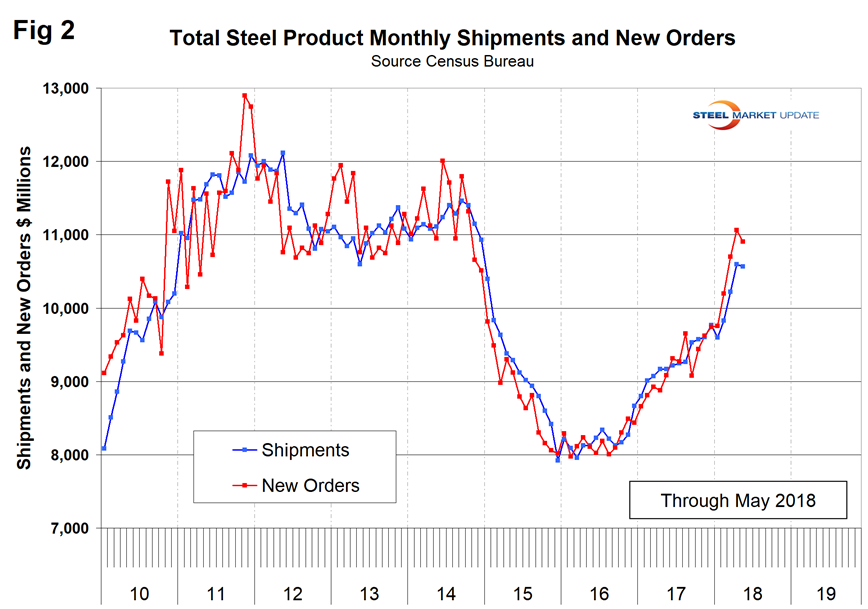
Figure 3 shows the same total shipment line as Figure 1, but now includes the inventory-to-shipment ratio. An excellent trend on both counts.
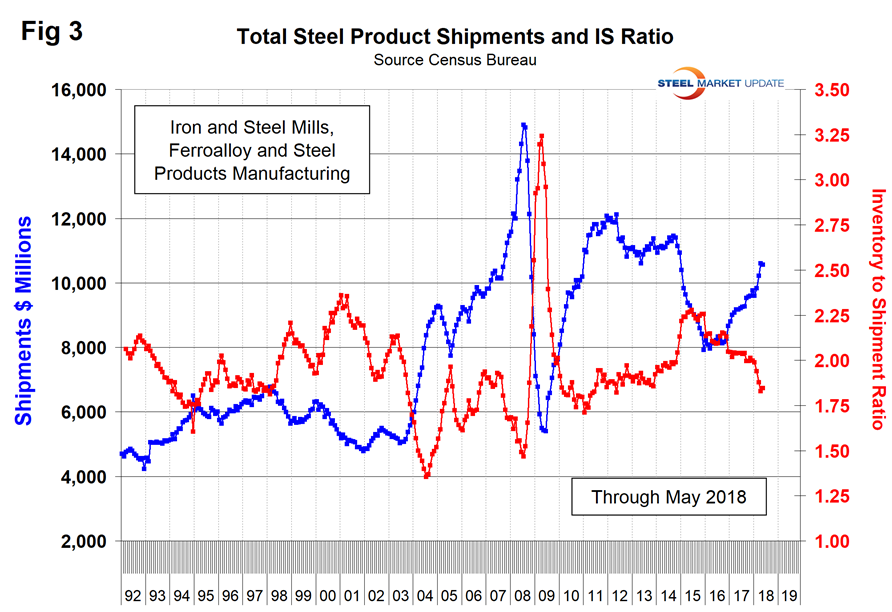
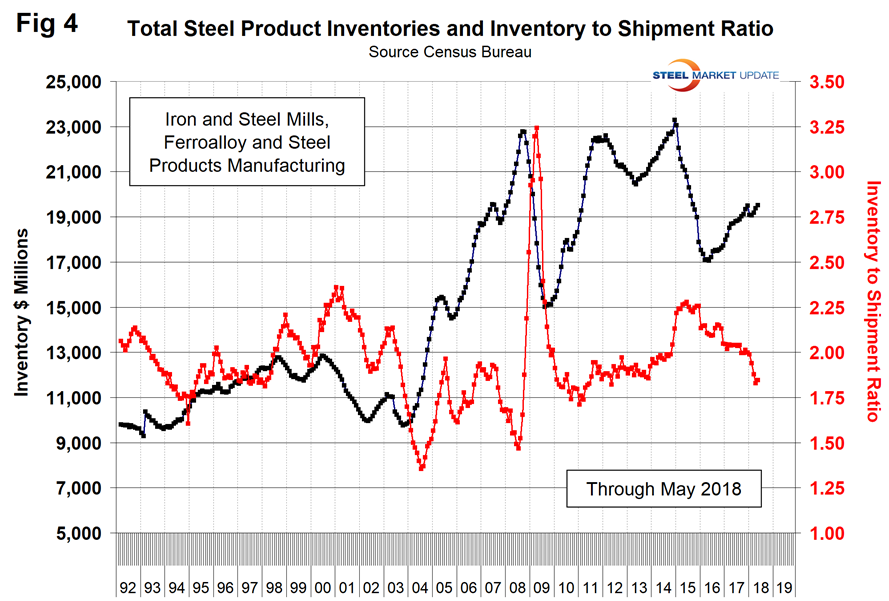
Figure 4 shows total inventory in millions of dollars and repeats the inventory-to-shipment ratio shown in Figure 3. Since July 2016, total inventories through May 2018 grew by 13.4 percent, and the inventory-to-shipment ratio declined from 2.09 to 1.85 in that timeframe. The ratio is down from 2.26 in January 2016. The lower the ratio—which is the number of months it would take to exhaust the inventories at that shipment level—the higher the rate of inventory turnover and the more efficient the operation.
SMU Comment: We try to review several different sources of comparable data to verify our conclusions and have been dissatisfied with industry shipment and inventory data from recognized sources for quite a while. This Census Bureau data looks more believable.


