Market Data

March 25, 2018
SMU Steel Market Trends Analysis: Week Ending March 23, 2018
Written by John Packard
Twice per month, once at the beginning of the month and then again in the middle of the month, Steel Market Update conducts an analysis of the trends impacting the flat rolled and plate steel markets. We invite 640 individuals associated with flat rolled and plate steels in purchasing, sales or executive positions at manufacturing, steel distribution, steel mill, trading company and toll processors. The goal is to better understand and measure trends in demand, purchasing, steel pricing, negotiations, lead times, spot price movement at service centers, foreign steel and more. As a result, we produce a tremendous amount of information, which is then shared with our Premium level members.
SMU just completed our analysis for mid-March 2018 and we want to share a portion of the results with Executive, Premium and those of you who are on a free trial of our newsletters.
As mentioned, we invited 640 individuals to participate in our mid-March questionnaire. Of those that responded (we normally receive 110-150 responses on any one survey) 47 percent were service centers, 40 percent were manufacturing companies, 6 percent were trading companies, 4 percent were steel mills and 3 percent were toll processors.
At the beginning of the questionnaire, we probe into how respondents feel about their company’s ability to be successful in both the current market environment, as well as three to six months into the future. The results of our SMU Steel Buyers Sentiment Index were published in Thursday’s issue, and on Sunday we have placed the article on our blog for everyone in the industry to enjoy.
Demand is Improving
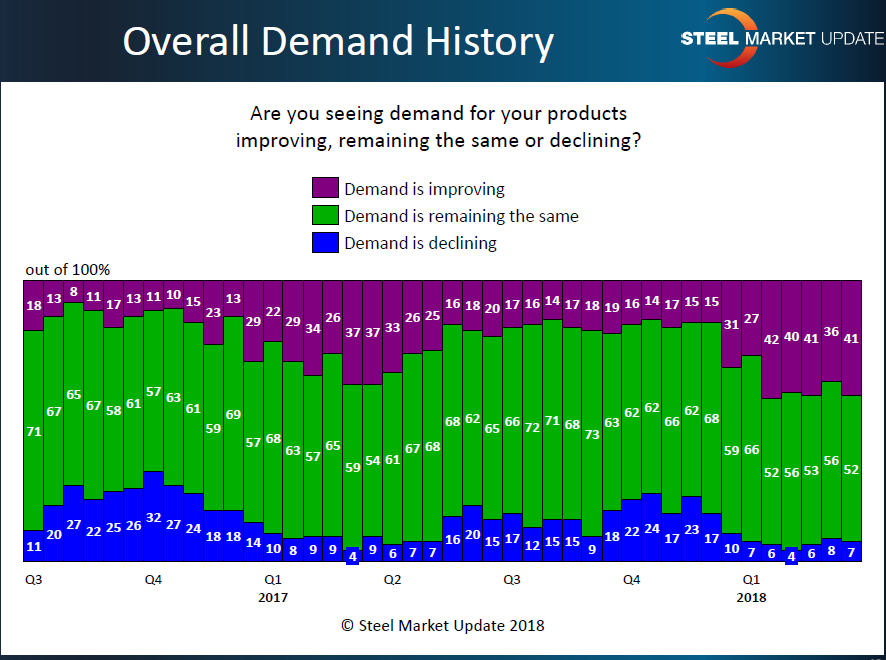
We look at demand in various ways during the survey process. We ask the pool of respondents how they are seeing demand for their products (improving, remaining the same or declining). The prevailing sentiment is that demand is stable or improving. About 41 percent of all respondents report demand as improving.
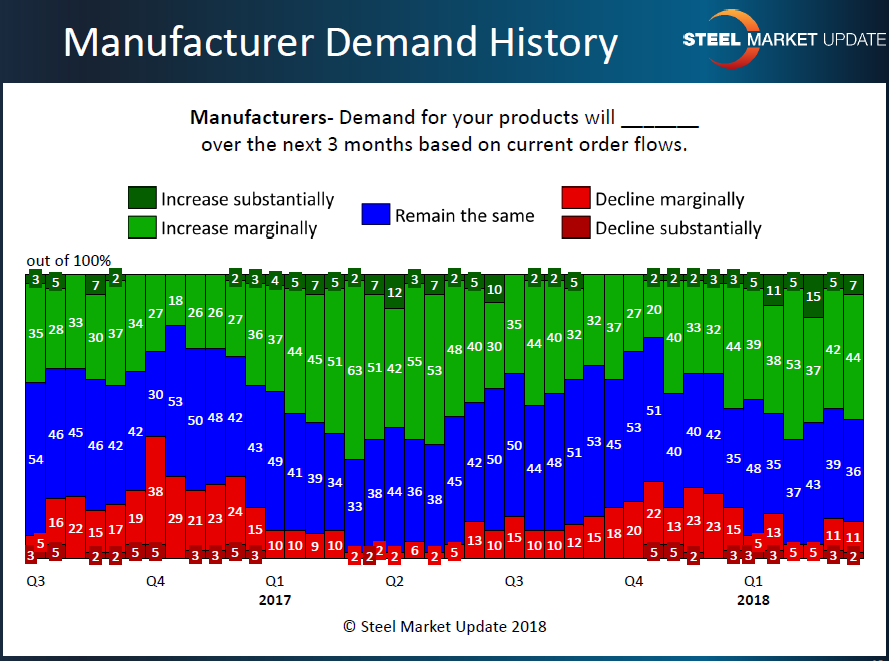
Manufacturers and service centers, which make up the vast majority of respondents, are asked independently about demand for their products. Fifty-one percent of the responding manufacturers reported demand as increasing marginally or substantially. Only 13 percent reported their business as in decline.
When comparing these numbers to what we saw one year ago, we find respondents slightly less enthusiastic heading into the second quarter. One year ago, 58 percent reported seeing an increase in demand.
Service centers are asked a slightly different question as SMU wants to know if their manufacturing customers are increasing orders, keeping them the same or reducing their orders. What we found is a little different than what the manufacturing companies reported in the graphic above. Thirty-seven percent of the distributors reported their manufacturing customers as increasing their orders, which is a consistent trend we have seen since the beginning of the year.
Mill Lead Times
On Thursday, we also provided an article on domestic steel mill lead times. That data is a combination of information collected independently from manufacturers and steel distributors. We find that service centers tend to be more extreme in their responses as to whether lead times are highly extended or extremely short.
First, here is how the manufacturers have been describing lead times over the past two years:
Clearly, manufacturing companies are having issues with lead times for new orders right now.
Service centers are also stressed by lead times, which from their perspective are either longer than normal (68 percent) or highly extended (17 percent).
We can better understand why the mills are able to take a hard stance when it comes to spot price negotiations with such a high percentage of manufacturing companies and service centers reporting long lead times. The longer lead times force buyers to order more steel to protect against running out of inventory.
Foreign Orders Moving to Domestic Mills?
One of the last items we looked at in last week’s survey was how manufacturing companies and service centers were responding to Section 232 tariffs with their suppliers. For example, we wanted to learn more about who was paying the tariffs associated with 232. We found the vast majority of both manufacturing companies (73 percent) and steel service centers (84 percent) reporting their company as being responsible for whatever the duties might be.
We also asked manufacturing companies and steel distributors if they were moving foreign steel orders to the domestic mills. Here we found the majority of the foreign orders were remaining off-shore (at least for now):
Shown here is a very small portion of the data we collect from the flat rolled and plate markets every month (twice per month). Every time we conduct an analysis of the flat rolled and plate markets, we produce a PowerPoint presentation that is shared with our Premium level members, as well as those who participate in our survey. If you would like information about how to get invited to take our survey, please send an email to info@SteelMarketUpdate.com. Please include your name, email address, phone number, company and title.
If you would like Premium access to the survey, as well as other proprietary products reserved for our Premium level members, please contact us at info@SteelMarketUpdate.com and we will advise you how to upgrade, the costs associated with Premium membership and what comes with it. There is also information online that you can review on your own.


