

Market Data

February 21, 2018
U.S GDP Grew in Every Region in Q2, Q3 2017
Written by Peter Wright
U.S. gross domestic product grew in every region of the country in last year’s second and third quarters, according to Bureau of Economic Analysis data.
The BEA introduced a new data set for GDP by state and region in 2014 and backdated it to Q1 2005. This week, the data was updated through Q3 2017. Even though this might be considered historically “old,” we think it’s worth reporting because it’s the foundation for where we are now.
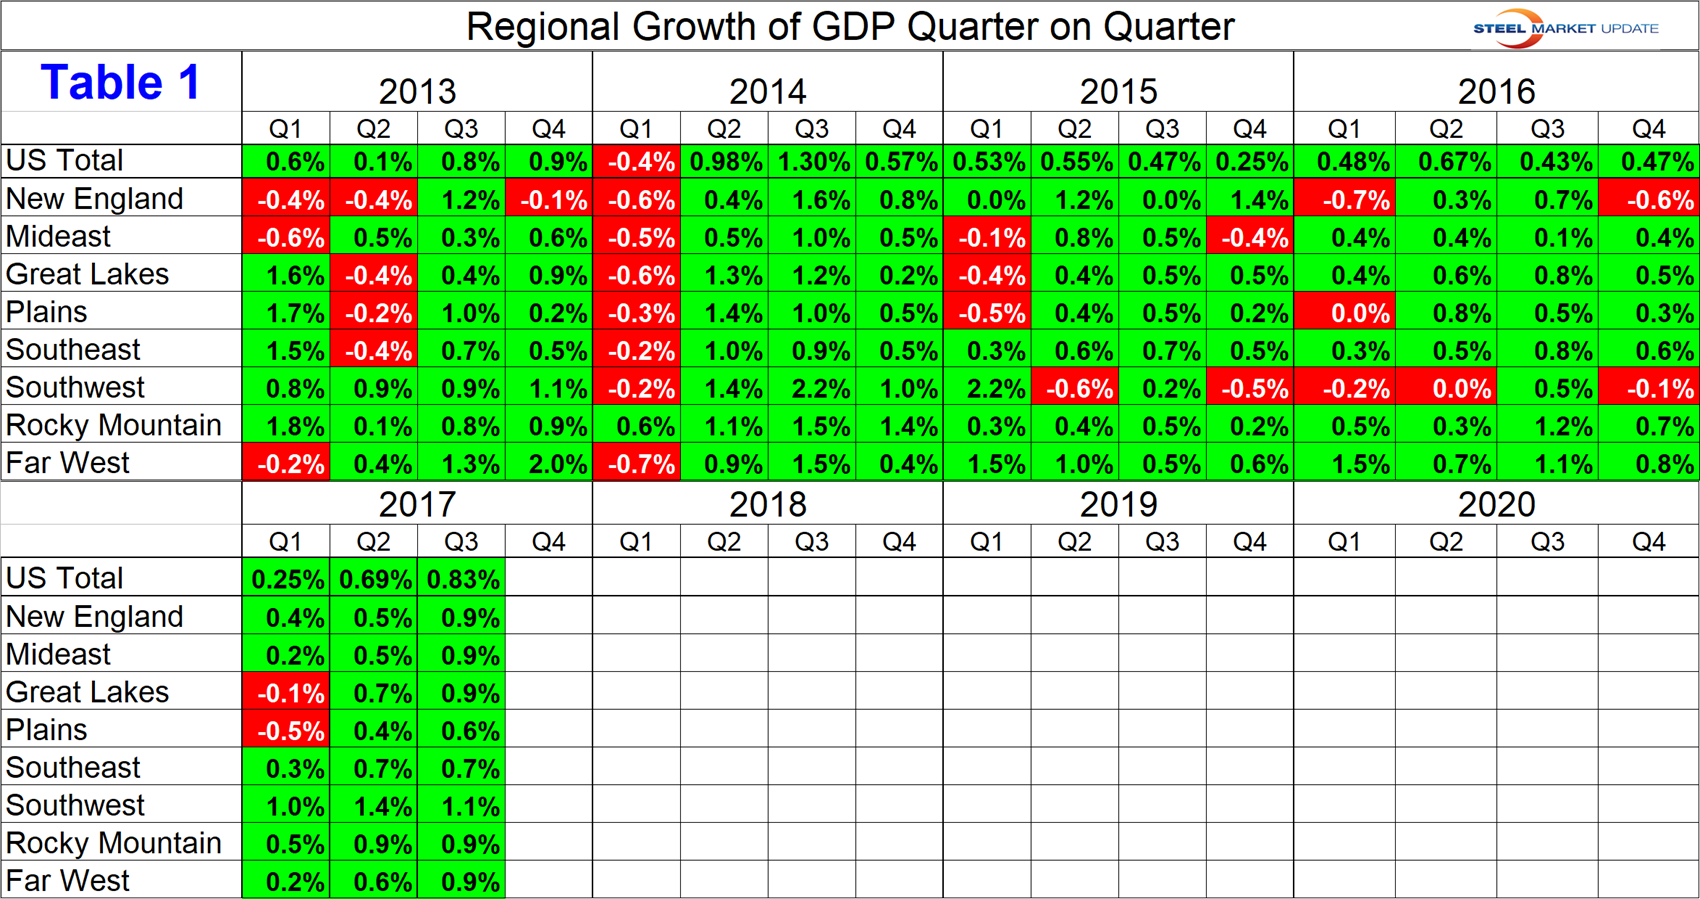
The data is published quarterly and is reported in chained 2009 dollars seasonally adjusted. Steel Market Update analyzes the data and reports to subscribers quarterly by region. Data and graphs for an individual state are available on request. Table 1 shows the growth of regional GDP in chained 2009 dollars quarter on quarter. (These numbers are not annualized as is the case for published reports of the growth of national GDP.) In the second and third quarters of 2017, every region had positive growth.
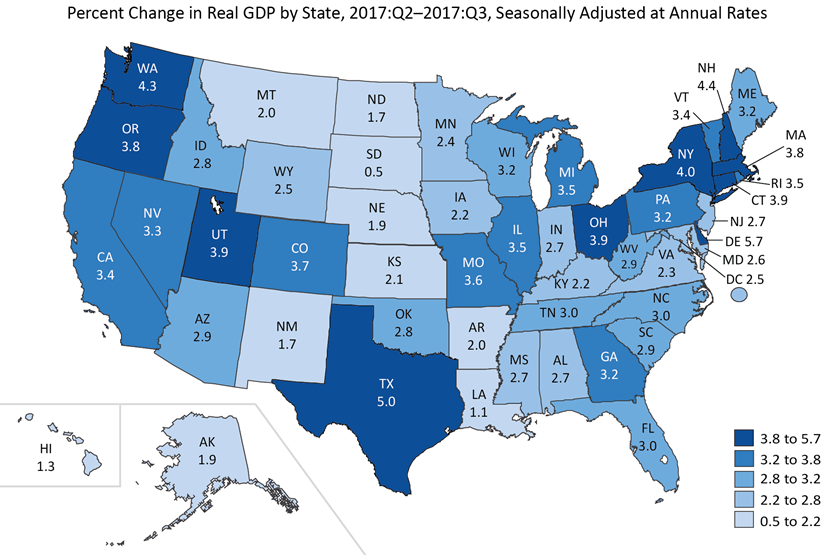
The BEA produces a map of the United States showing quarter-over-quarter growth by state within each region. Included here is the map for Q3 2017 extracted from the BEA website to enable readers to see how their individual states progressed between Q2 2017 and Q3 2017. Texas had the highest growth rate at 5.0 percent and South Dakota the lowest at 0.5 percent.
Regions as defined by the BEA are as follows:
New England: Connecticut, Maine, Massachusetts, New Hampshire, Rhode Island, Vermont.
Mideast: Delaware, DC, Maryland, New Jersey, New York, Pennsylvania.
Great Lakes: Illinois, Indiana, Michigan, Ohio, Wisconsin.
Plains: Iowa, Kansas, Minnesota, Missouri, Nebraska, North Dakota, South Dakota.
South East: Alabama, Arkansas, Florida, Georgia, Kentucky, Louisiana, Mississippi, North Carolina, South Carolina, Tennessee, Virginia, West Virginia.
South West: Arizona, New Mexico, Oklahoma, Texas.
Rocky Mountain: Colorado, Idaho, Montana, Utah, Wyoming.
Far West: Alaska, California, Hawaii, Nevada, Oregon, Washington.
In the third quarter of 2017, the South West had the highest growth rate at 1.1 percent. The Plains had the lowest growth rate at 0.6 percent.
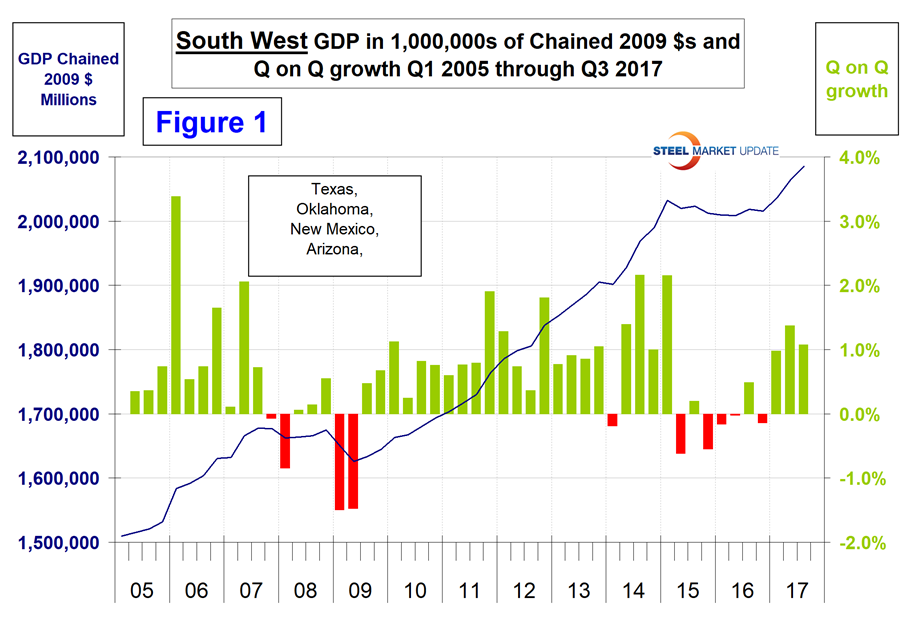
Once per quarter, SMU publishes a report of regional job creation to help subscribers compare their own corporate results with those of other companies in their region. Figure 1 shows subscribers an example of the graphs available on request for individual regions and states. This case shows the results for the South West region, which suffered belatedly from the oil price collapse in third-quarter 2014. GDP in the South West didn’t respond until second-quarter 2015, and once oil got back above $50 per barrel the economy in the region began to roll again.
The U.S. values in this report are different and lower that the official report published in National Income and Product Account (NIPA) reports partly because the GDP-by-state numbers exclude federal military and civilian activity located overseas (because it cannot be attributed to a particular state). In addition, the official quarterly report of national GDP is annualized, which increases the value by a factor of four.


