Market Data

January 26, 2018
BLS: Pacific Region's Tops in Job Creation
Written by Peter Wright
Which region of the United States is tops in job creation? The Pacific now has the greatest number of employed people of all 10 regions and in 2017 created the most jobs, according to Steel Market Update’s latest analysis of government employment data.
Fourth-quarter employment data by state was released by the Bureau of Labor Statistics (BLS) on Tuesday. Economy.com summarized as follows: “The December job numbers for state and regional economies put 2017 into the books and show that the strength of the U.S. economy is evident across all regions of the country. More states reported that employment rose in December versus November, with the fastest over-the-month job growth in Wyoming, Montana and Oregon. Employment fell in Maryland, Arkansas and New Hampshire. Hawaii once again reported the lowest unemployment rate, and in three states—California, Hawaii and Mississippi—the rates set new lows dating back to 1976.”
The states compile their employment numbers independently of the Feds, and then both are reported by the BLS. The results are close. In the last 20 quarters since Q1 2013, the Feds reported total job creation of 12,316,000 and the states reported 12,577,000, a difference of just 2.1 percent. Figures 1 and 2 show the history of federal and state totals since 1992. SMU has graphs in the same format for 10 geographic regions and can produce them for individual states on request.
The 10 geographic regions described in this report are:
New England, (CT, ME, MA, NH, RI, VT)
North East, (NY, PA, NJ)
Mid Atlantic, (DE, DC, MD, NC, SC, VA, WV)
North Central, (IA, KS, MN, MO, NE, ND and SD)
East North Central (IL, IN, MI, OH and WI)
East South Central, (AL, KY, MS and TN)
South Central, (TX, OK, LA and AR)
Mountain, (AZ, CO, ID, MT, NV, NM. UT, WY)
Pacific region, (CA, OR and WA)
South East, (FL, GA)
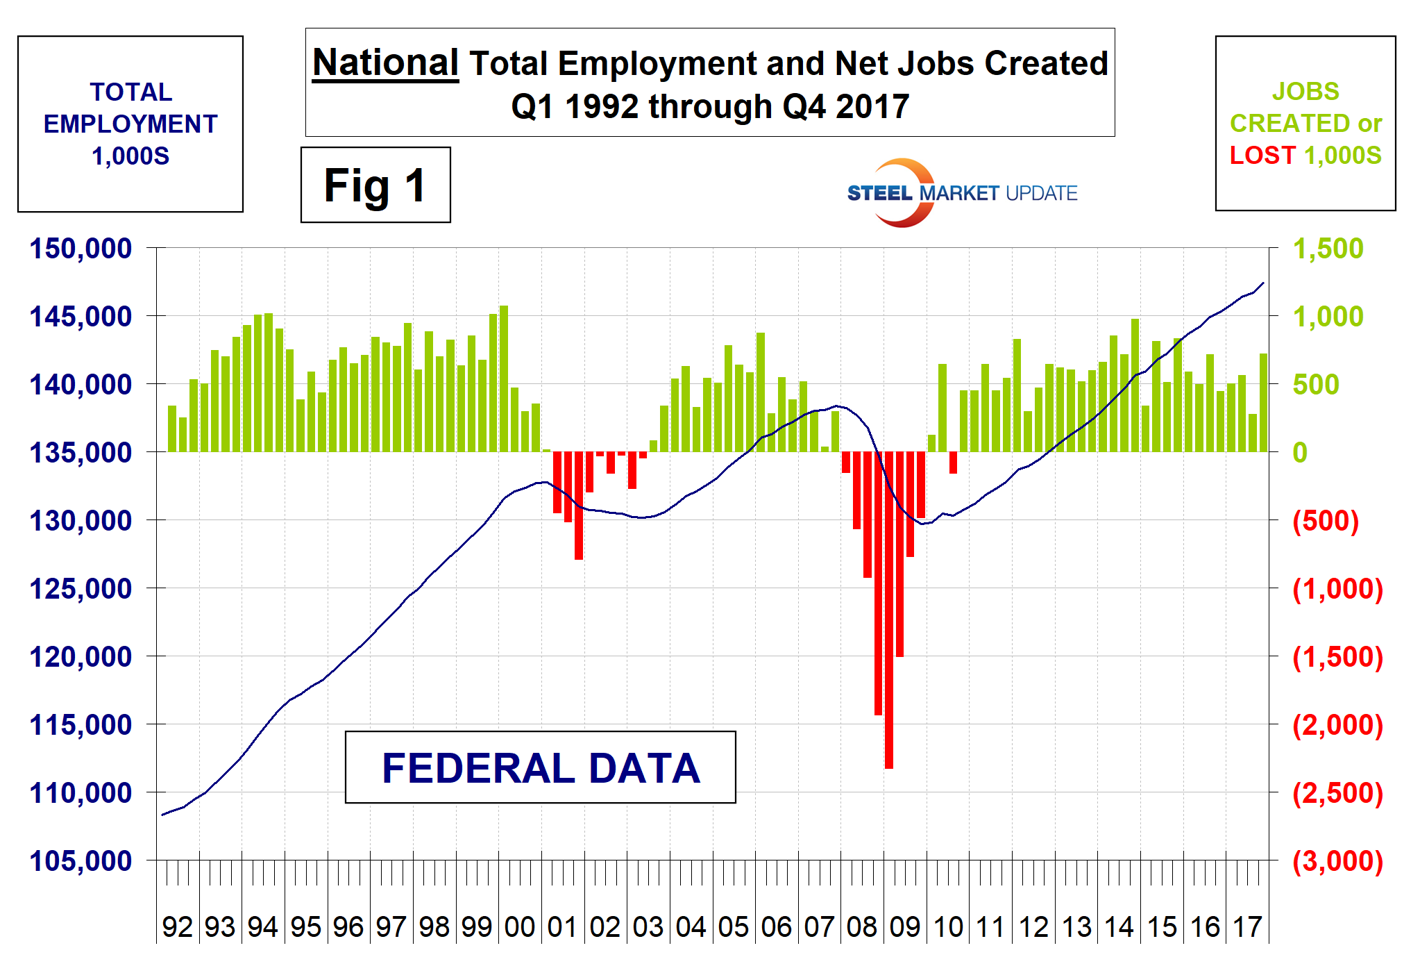
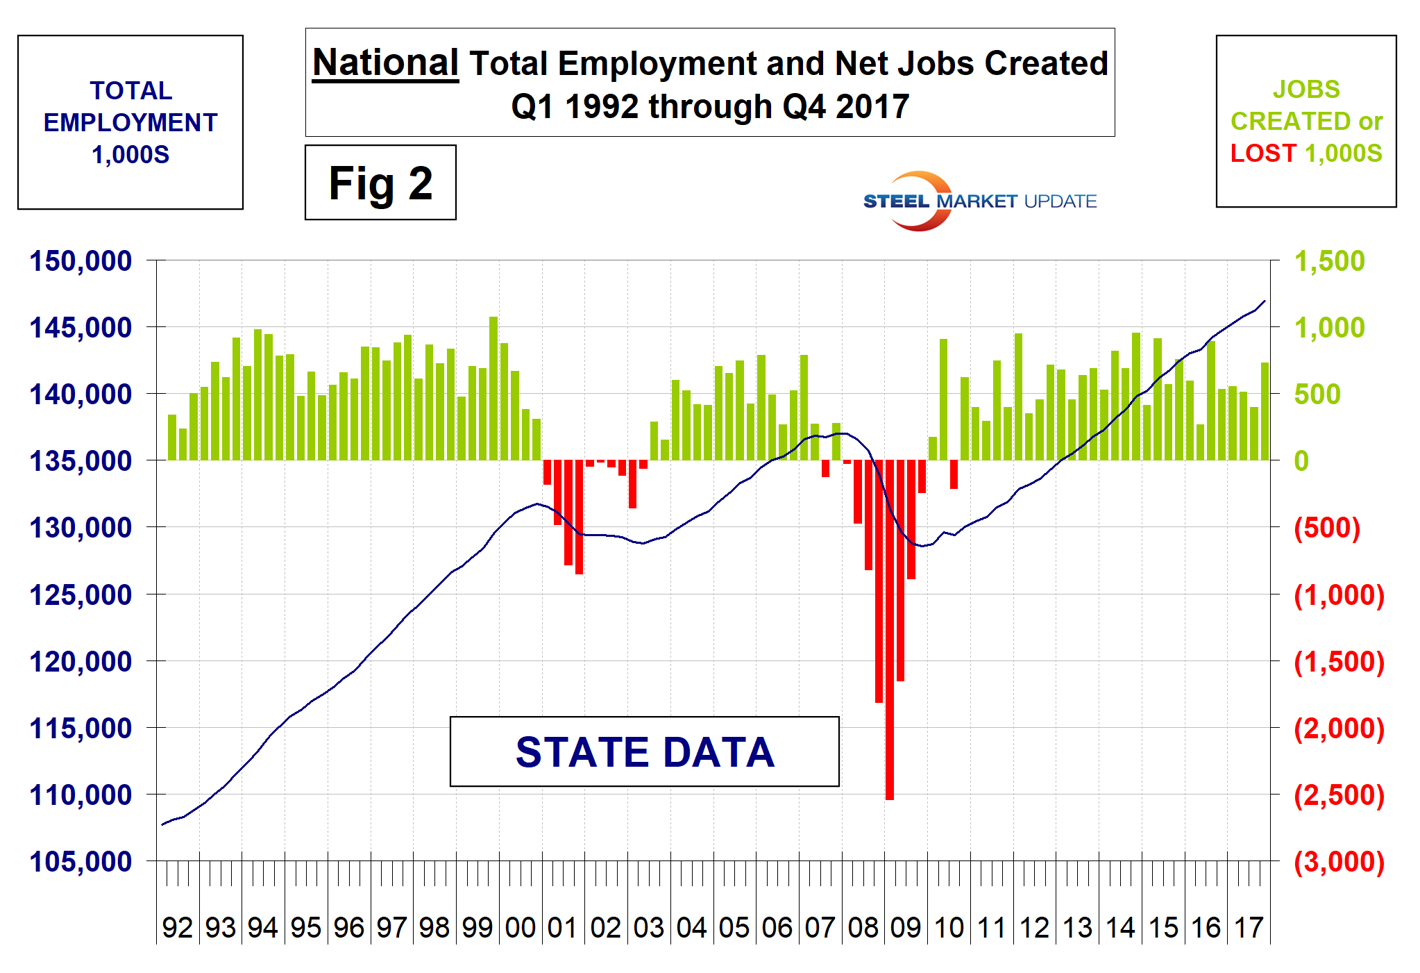
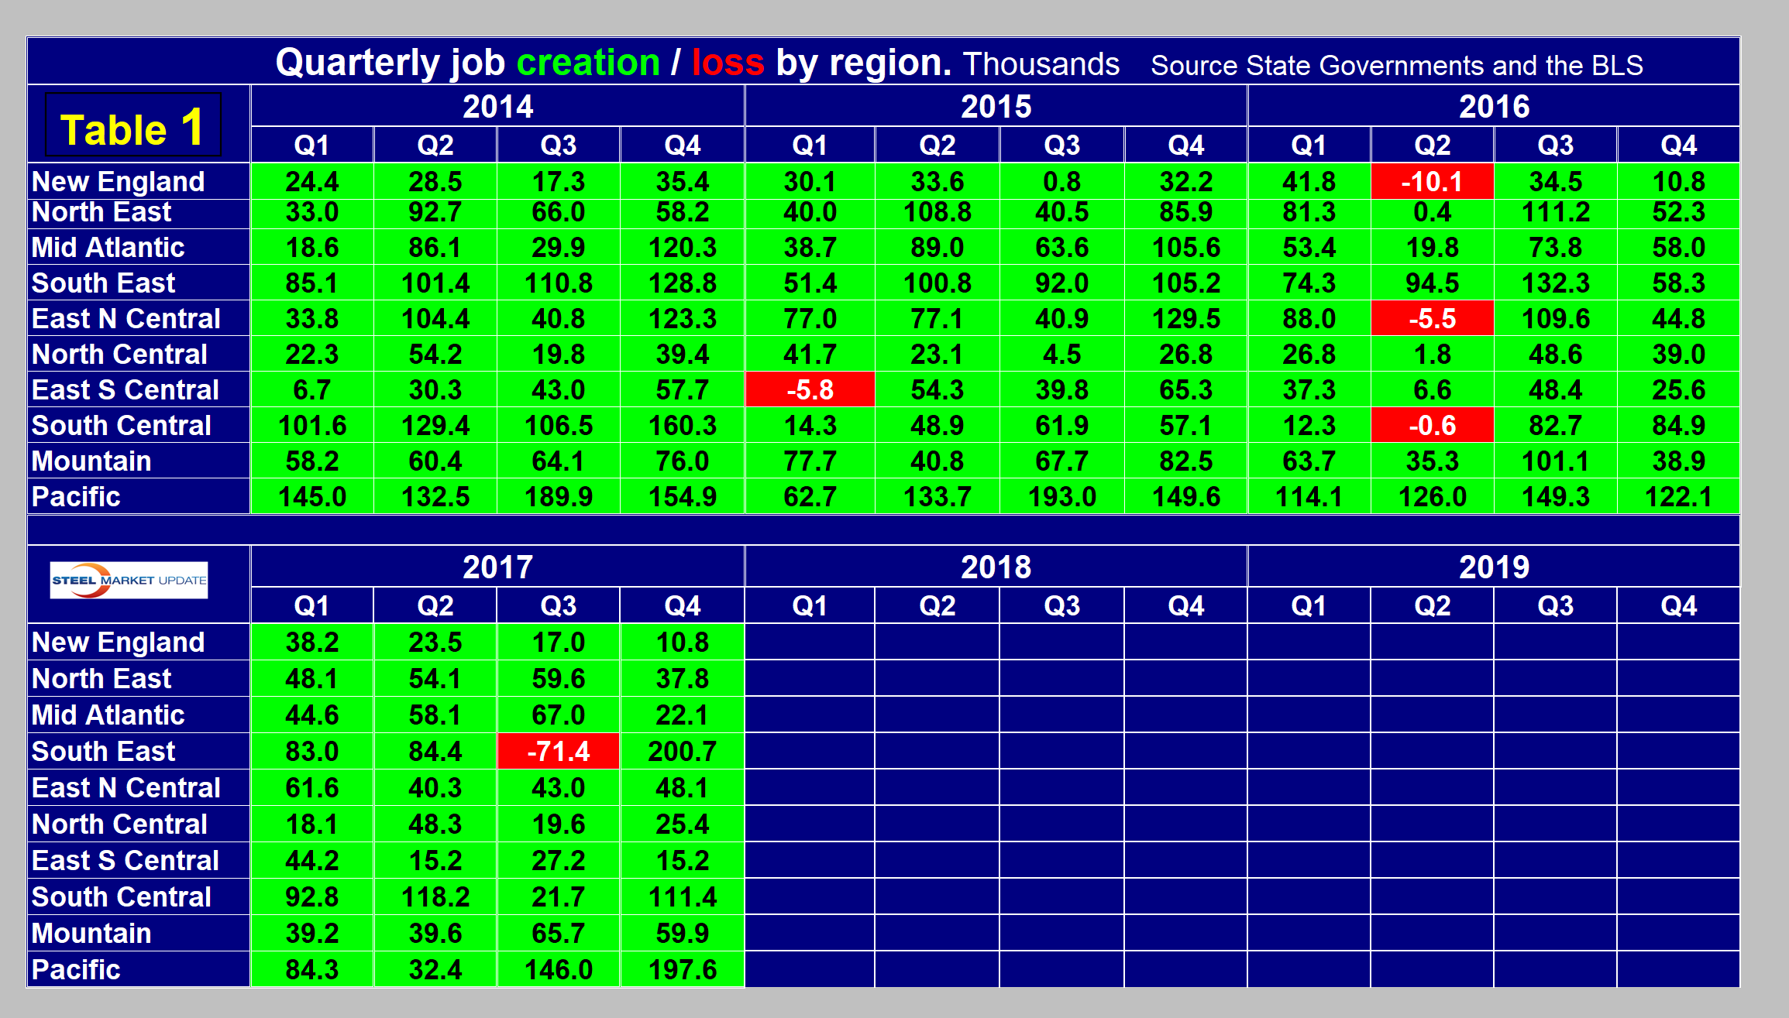
Table 1 shows the history of quarterly job creation by region since Q1 2014. In the fourth quarter, the South East had a terrific rebound that largely made up for the hurricane losses incurred in the third quarter. Texas had a net gain of zero in August, a loss of 7,000 jobs in September, recovered strongly in October and November, but gained only 400 jobs in December. Other oil producing states, Oklahoma, North Dakota and Louisiana, had a net gain of zero in December. By far the strongest state in December was California with a gain of 53,000 jobs. Comparing Q4 with Q3, job creation in the South East was strong because of the hurricane bounce back, and the West Coast improved by 60 percent, but other regions were lackluster. All regions except the N. Central, the E.N Central and the S. Central had a lower rate of job growth in Q4 compared to Q3, but all had a positive net gain.
The regions have fared very differently since the pre-recession high of first-quarter 2008 and since the low point of fourth-quarter 2009. By the states’ calculations, there are now 9,942,000 more people employed than there were immediately before the recession, but of that number 42 percent occurred in the South Central and Pacific regions (Table 2).
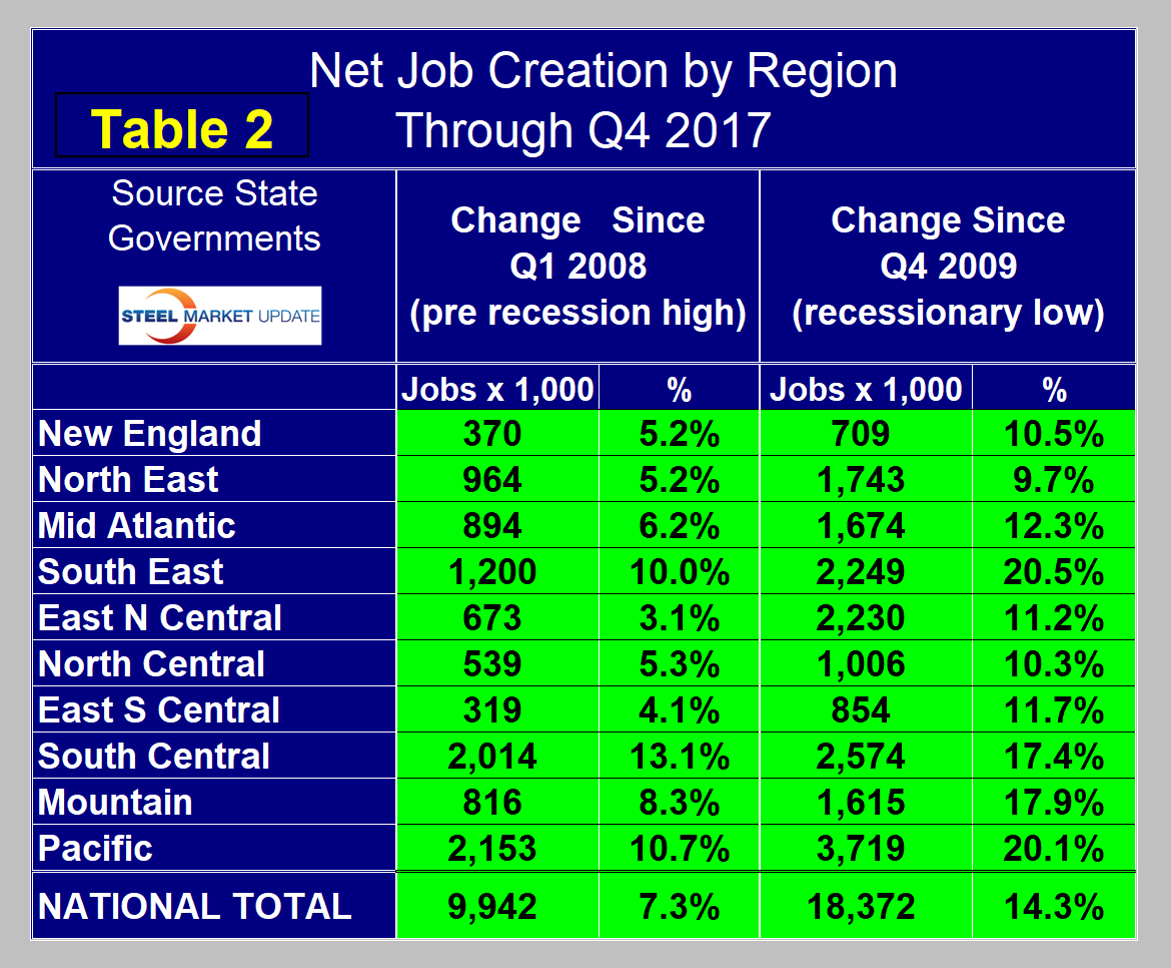
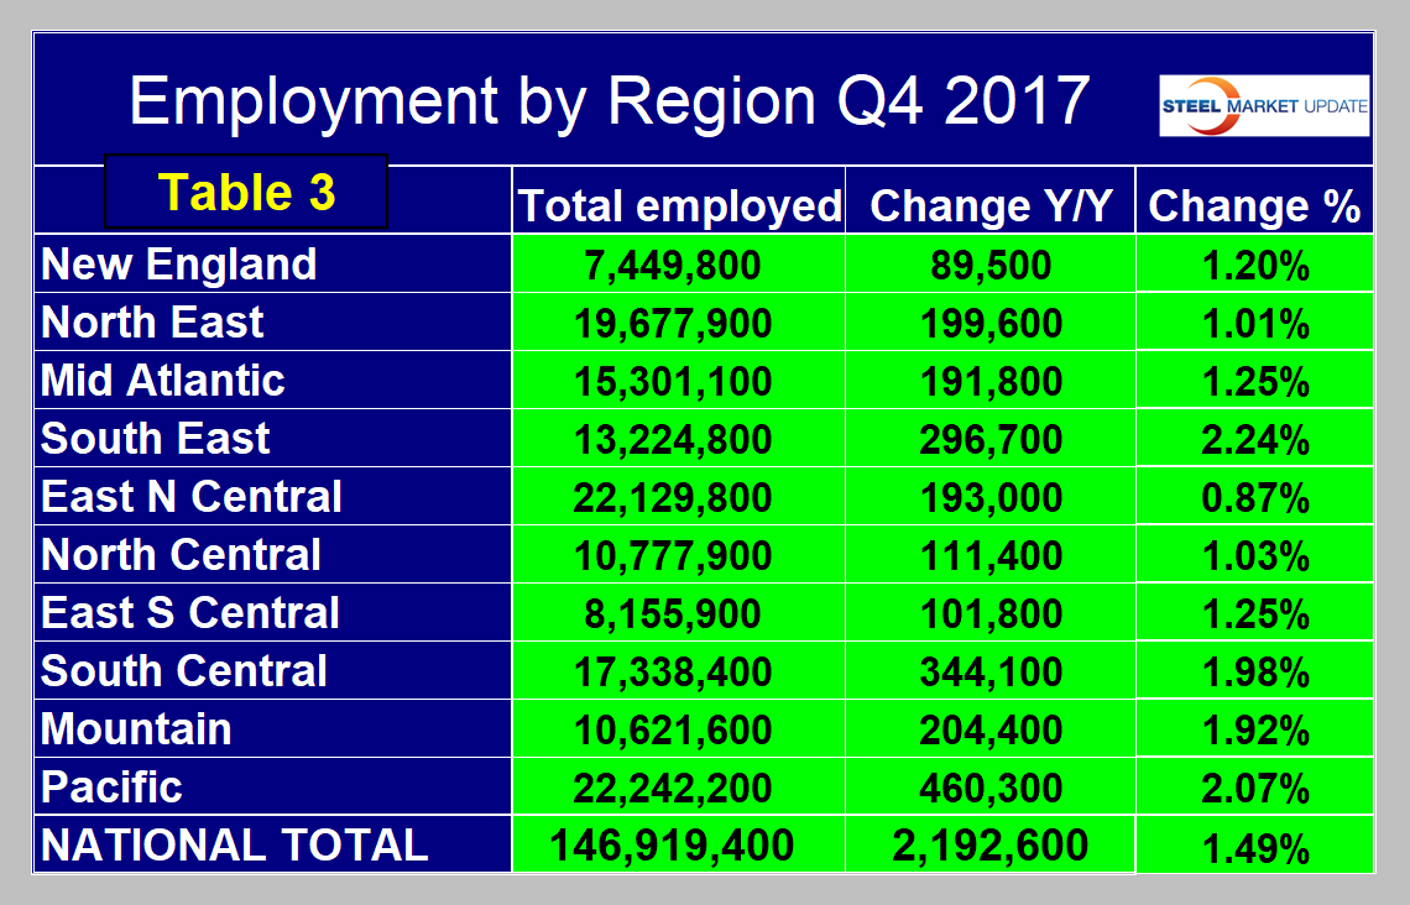
The third quarter of 2015 was the first time that every region had more people employed than it did at the pre-recession peak. The Pacific has had the largest number of jobs created during the recovery with an increase of 3,719,000 positions, which amounts to 20.1 percent of total employment. The Pacific region also had the largest number of job losses during the recession. In second place during the recovery is the South Central region with 2,574,000 jobs created, closely followed by the East North Central and the South East. Employment is now 18,372,000 positions higher than it was at the low point of the recession. In the fourth quarter, the Pacific region took the No. 1 spot for the total number of employed people away from the East North Central (Table 3).
SMU Comment: We believe it’s important for those subscribers whose businesses are substantially regional to have as much data as possible to compare their own results with those of their locality. This report, along with our quarterly report on regional GDP, is intended to help in that respect.