Analysis

January 24, 2018
Auto Production Decelerates in December
Written by Peter Wright
Auto and light truck production continued to decelerate in December, even in Mexico, according to the latest Steel Market Update analysis of auto production in the NAFTA region.
U.S. Vehicle Sales
Economy.com reported that a tumultuous 2017 ended on a high note. “U.S. December vehicle sales posted a seasonally adjusted annualized rate of 17.85 million units, which was above consensus expectations. Incentives cooled as automakers focused mainly on preserving profit margins rather than taking market share. Retail sales, rather than fleet sales, were the main driver of a stronger end to the year. Consumers continued to flock toward crossovers, SUVs and pickup trucks. In 2017, new-vehicle sales totaled 17.27 million units, posting the first year-over-year decline since 2009.”
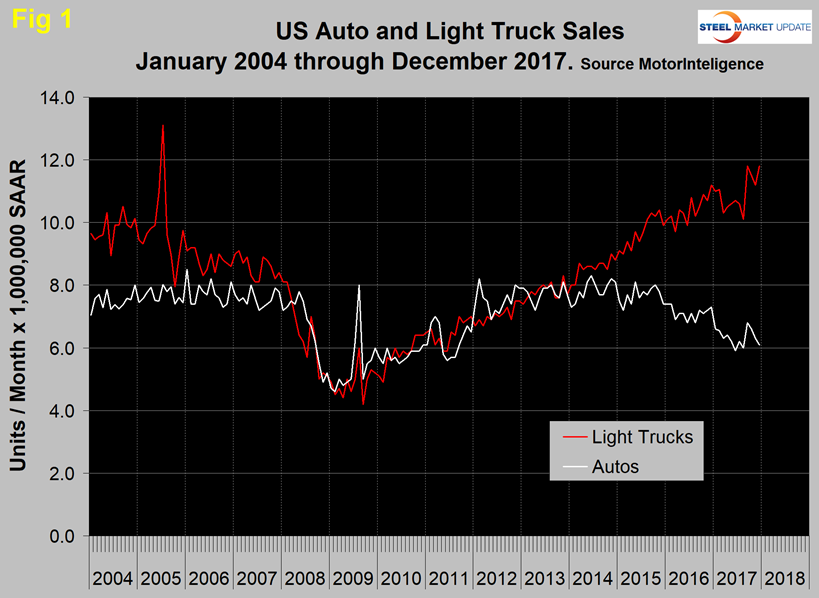
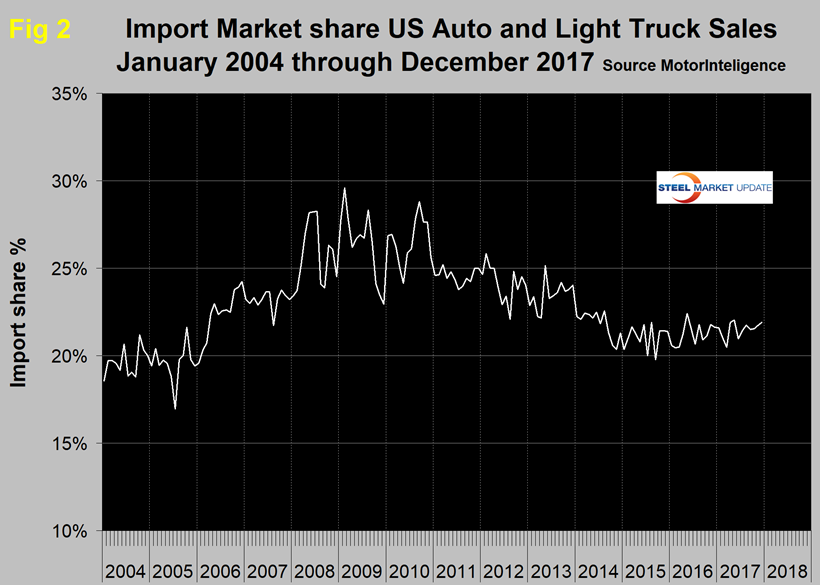
Figure 1 shows auto and light truck sales since January 2004. Import market share at 21.9 percent in December has changed little in the last 18 months as shown in Figure 2.
NAFTA Vehicle Assemblies
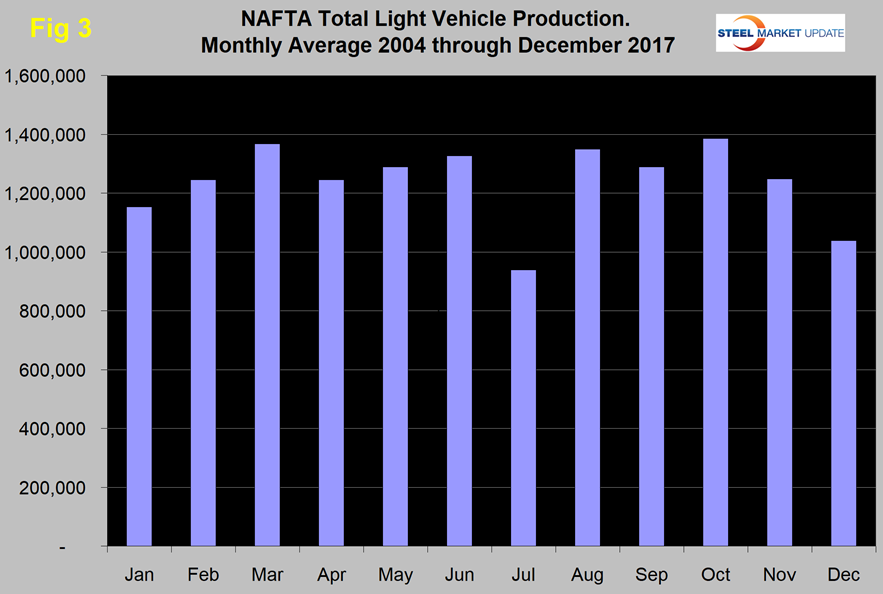
Total light vehicle (LV) production in NAFTA in December was at an annual rate of 13.56 million units, down from 17.19 million in November. On average since 2004, December’s production has been down by 16.8 percent from November. This year production was down by 21.1 percent, therefore weaker than normal (Figure 3). Year to date through December 2017, production was down by 4.5 percent from the 12 months of 2016. Note that production numbers are not seasonally adjusted; the sales data reported above are seasonally adjusted.
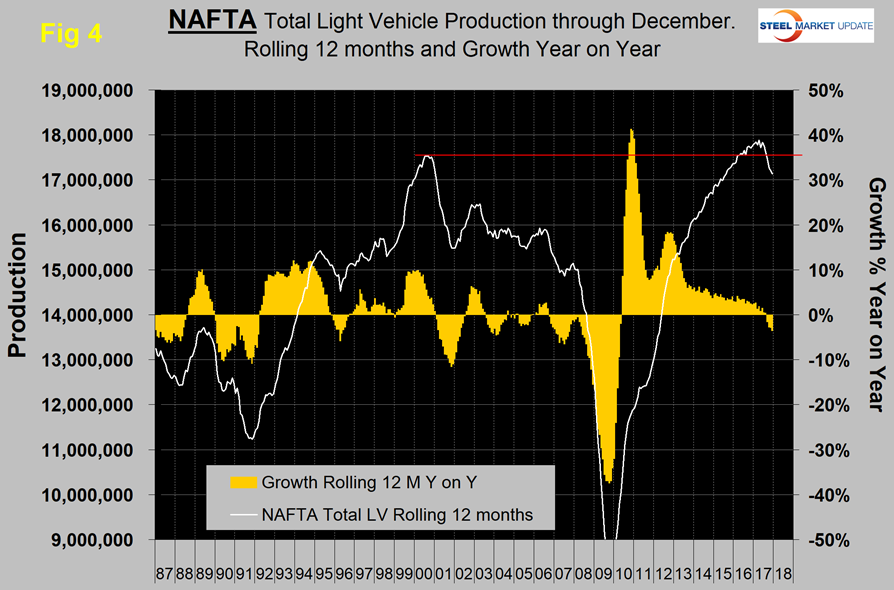
On a rolling 12-month basis year over year through December, LV production in NAFTA decreased by 3.6 percent. September through December were the first months to experience a decrease since May 2010. There has been a very gradual slowdown in growth for the last three years as indicated by the brown bars in Figure 4.
On a rolling 12-month basis year over year, total light vehicle production in the U.S. declined by 8.3 percent, Canada declined by 8.6 percent, while Mexico was up by 11.5 percent. The comparison is worse for all three nations comparing the latest three months year over year, with the U.S. down by 9.1 percent, Canada down by 13.9 percent and Mexico up by 8.1 percent (Table 1).
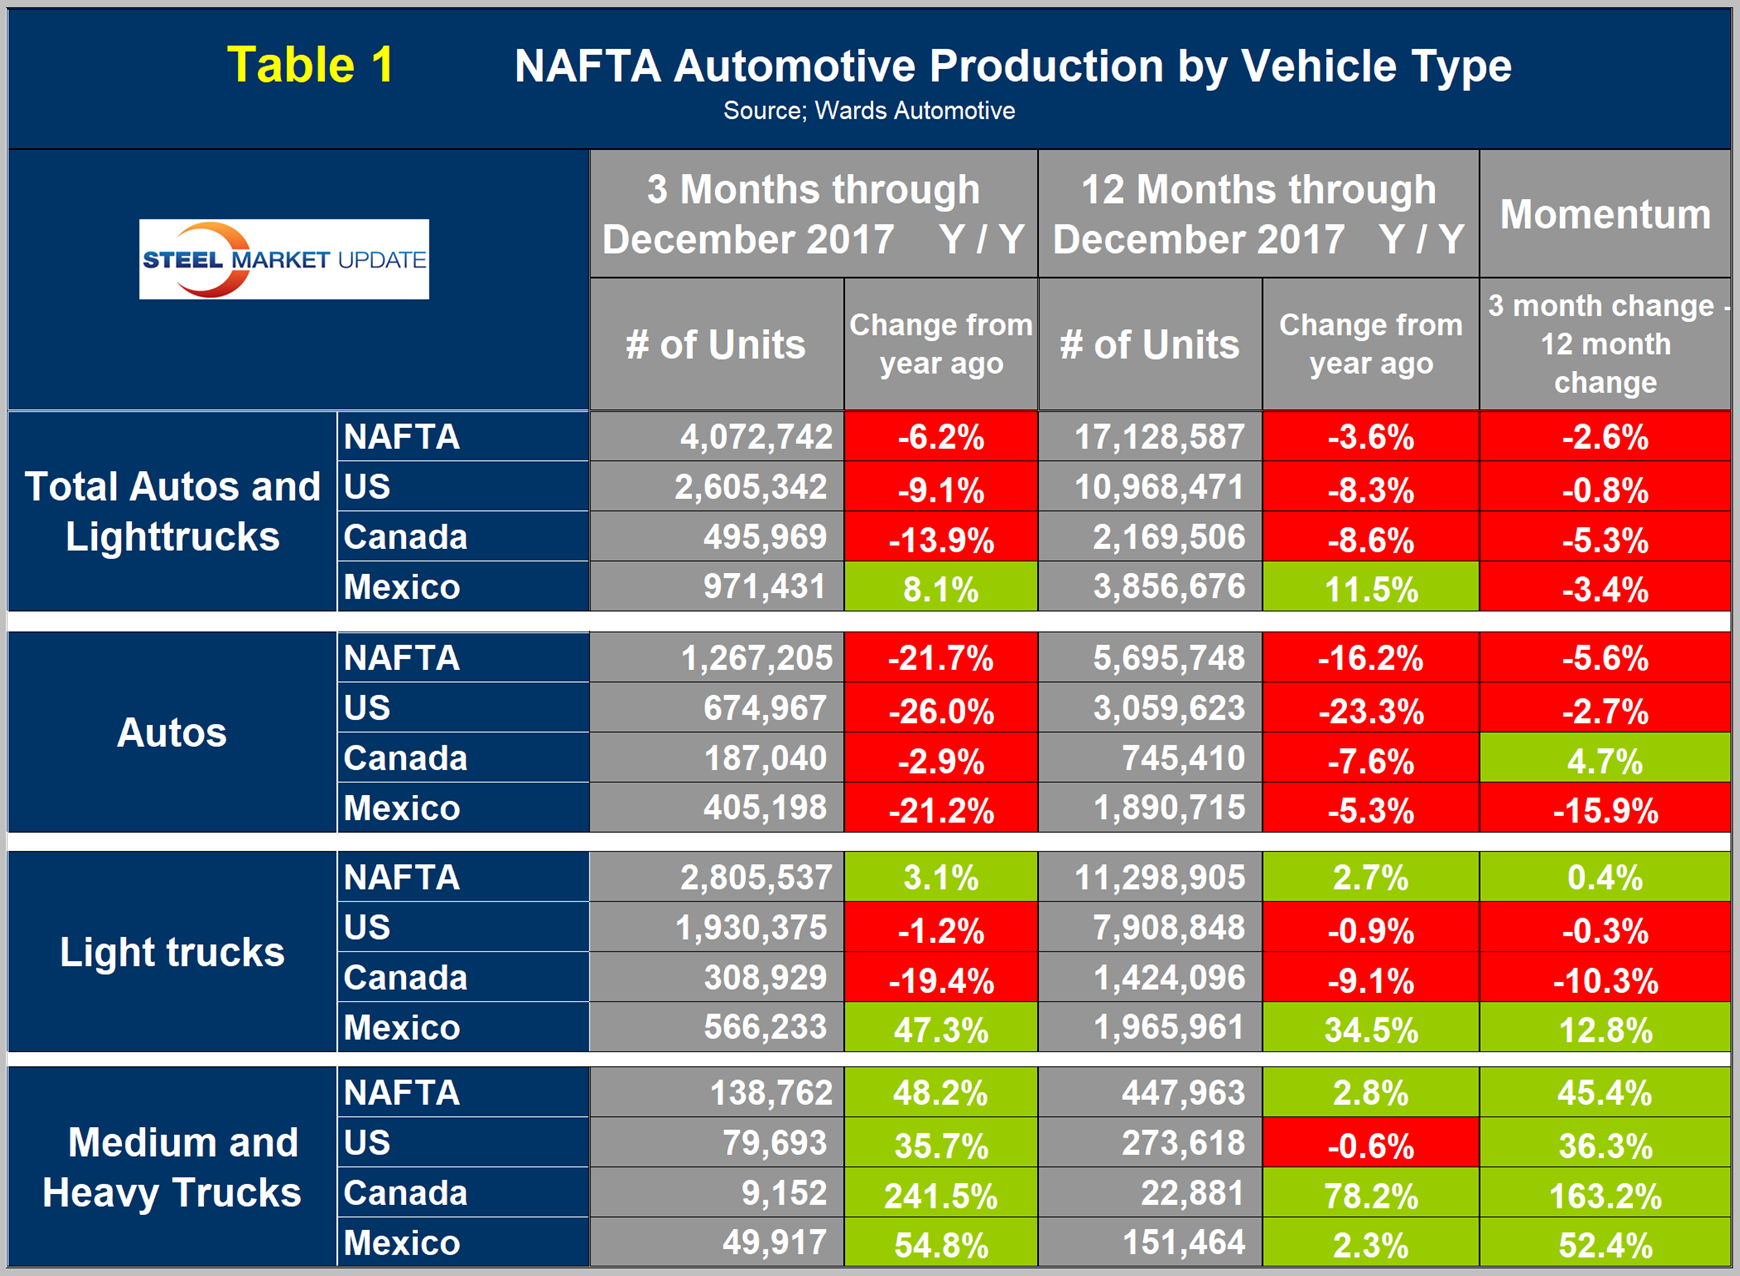
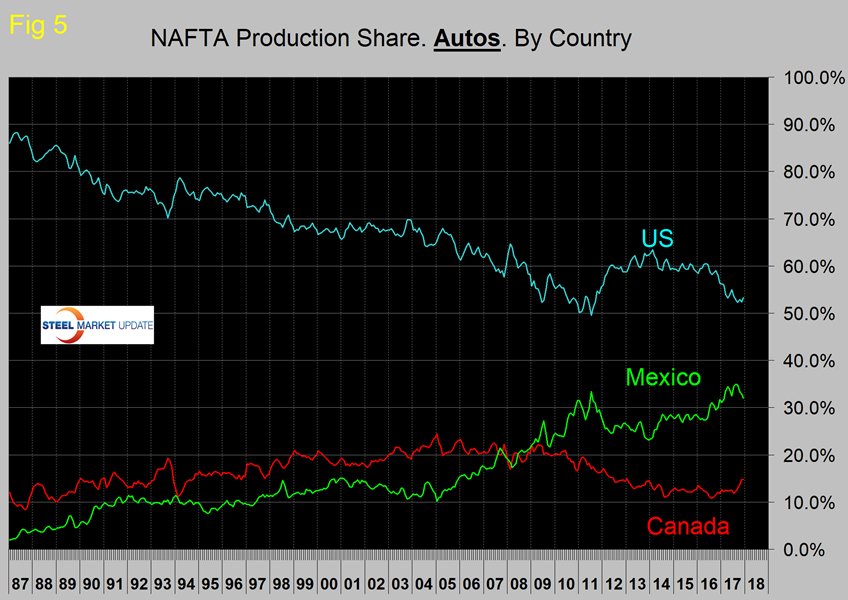
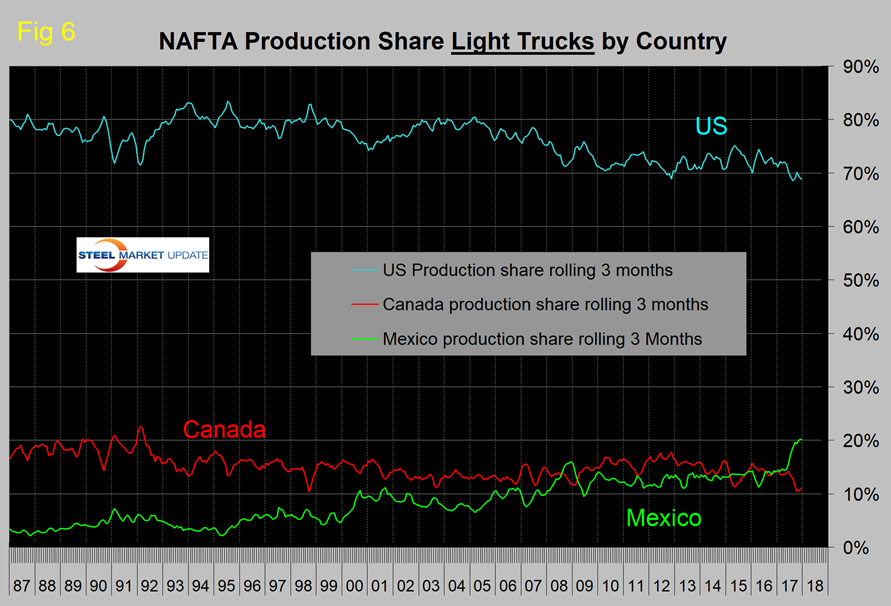
North America is experiencing a huge shift in assembly volume of both autos and light trucks from both the U.S. and Canada to Mexico. The shift south of the border is illustrated in Figures 5 and 6, which show production share for autos and light trucks, respectively. November and December were the first months ever for Mexico’s share of light trucks to exceed 20 percent. The Mexican light vehicle production target for 2020 is 5.0 million units, according to Eduardo Solis, president of the Mexican Automotive Industry Association. At this rate, Mexico will exceed Sr. Solis’ target.
Figures 7-9 show total LV production by country. The brown bars are the respective growth rates, which tells the whole story. The red line on each chart shows the change in production since Q2 2006. Note the scales are the same to give true comparability and that Mexican growth surged in 2017. Mexican exports of light vehicles hit a record in 2017 at 3.1 million units with the U.S at 2.3 million units being the primary destination. Mexico currently exports about 80 percent of its LV production. Canada is the second highest volume destination.
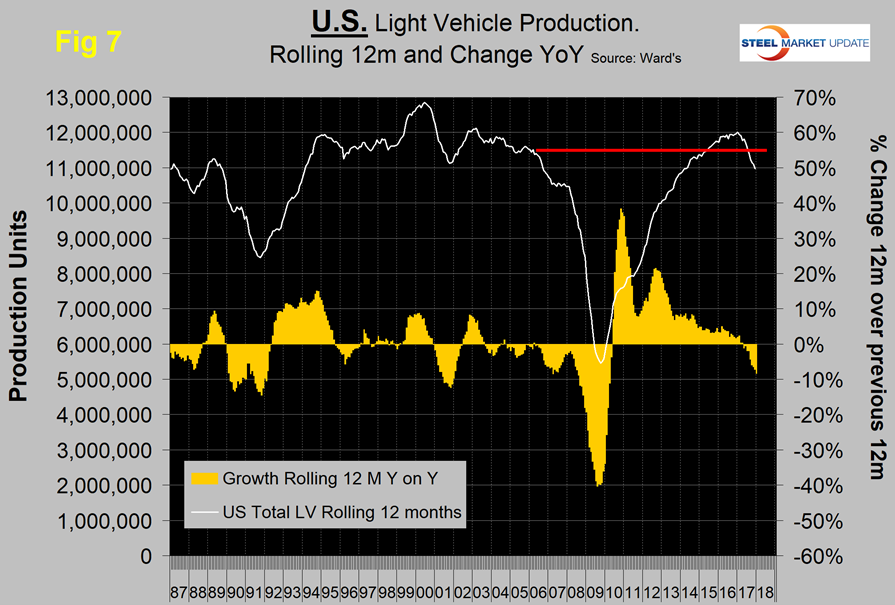
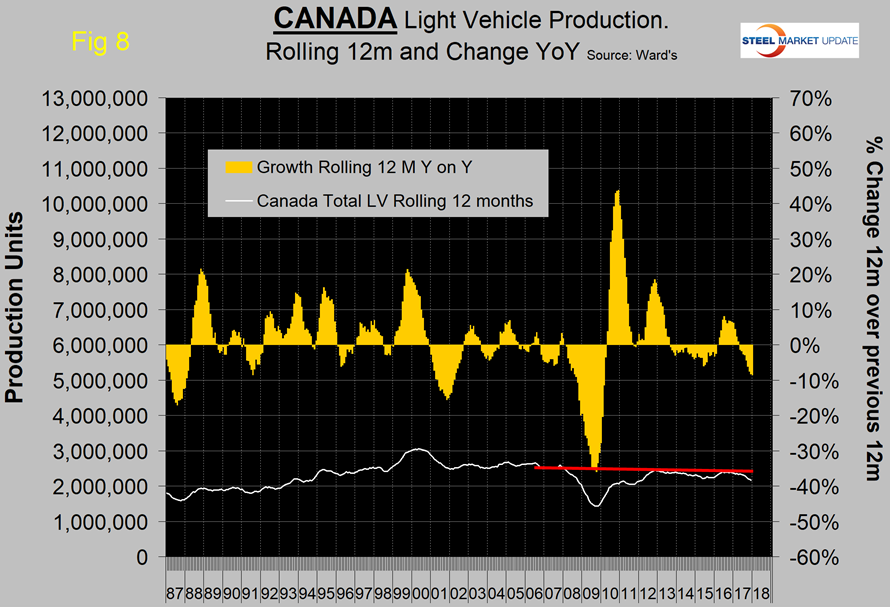
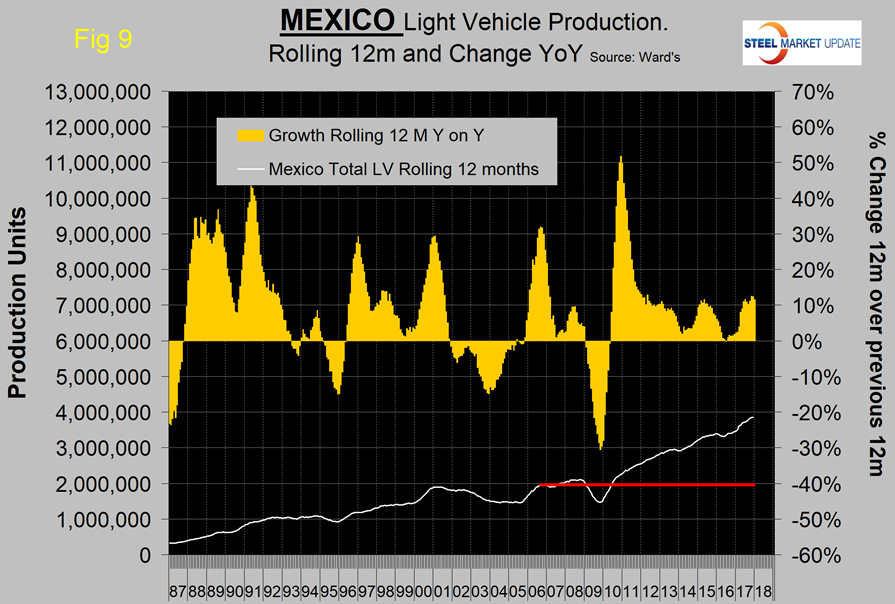
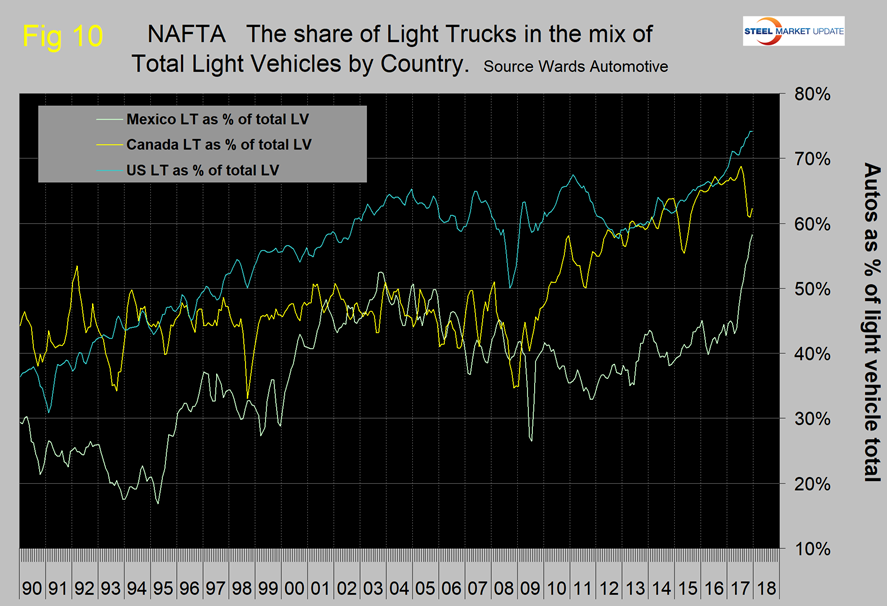
Figure 10 shows that the percentage of light trucks in the light vehicle mix has been increasing for all three countries since the recession with an extreme surge for Mexico in the last nine months. In general, car sales—including four door sedans, two-door coupes, station wagons and hatchbacks—continue to substantially underperform their SUV, crossover and pickup truck counterparts.
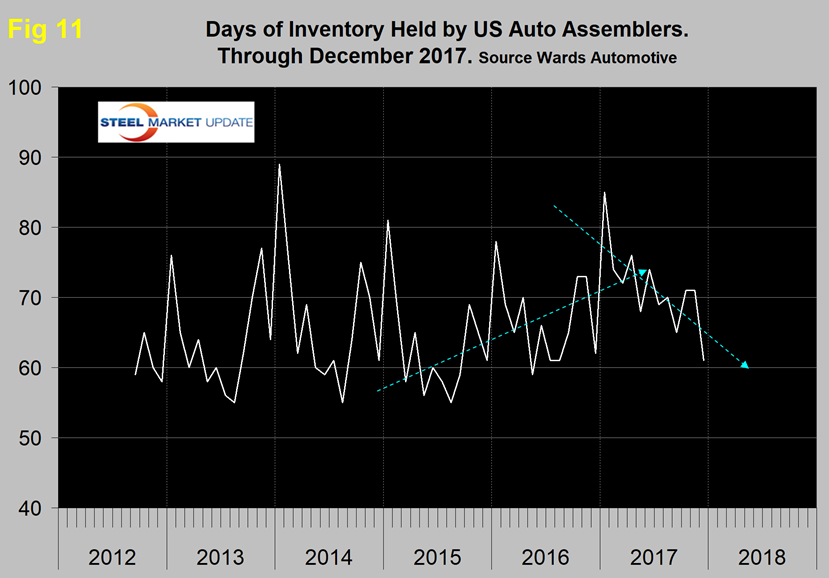
Ward’s Automotive reported this week that total light vehicle inventories in the U.S. averaged 61 days at the end of December, down 10 days from the end of November. Month over month, Fiat Chrysler Automotive’s inventory decreased by 3 to 85 days, GM was down by 20 to 63 days and Ford was down by 10 to 68 days. To put those results into perspective, Toyota was down by 9 to 50 days. Figure 11 shows that in 2017, the auto companies reversed a two-year trend of rising inventories.;
The SMU data file contains more detail than can be shown here in this condensed report. Readers can obtain copies of additional time-based performance results on request. Available are graphs of auto, light truck, medium and heavy truck production, as well as growth rates and production share by country.


