

Prices

January 19, 2018
Oil Price Surges to Over $60 Raising Hopes for OCTG
Written by Tim Triplett
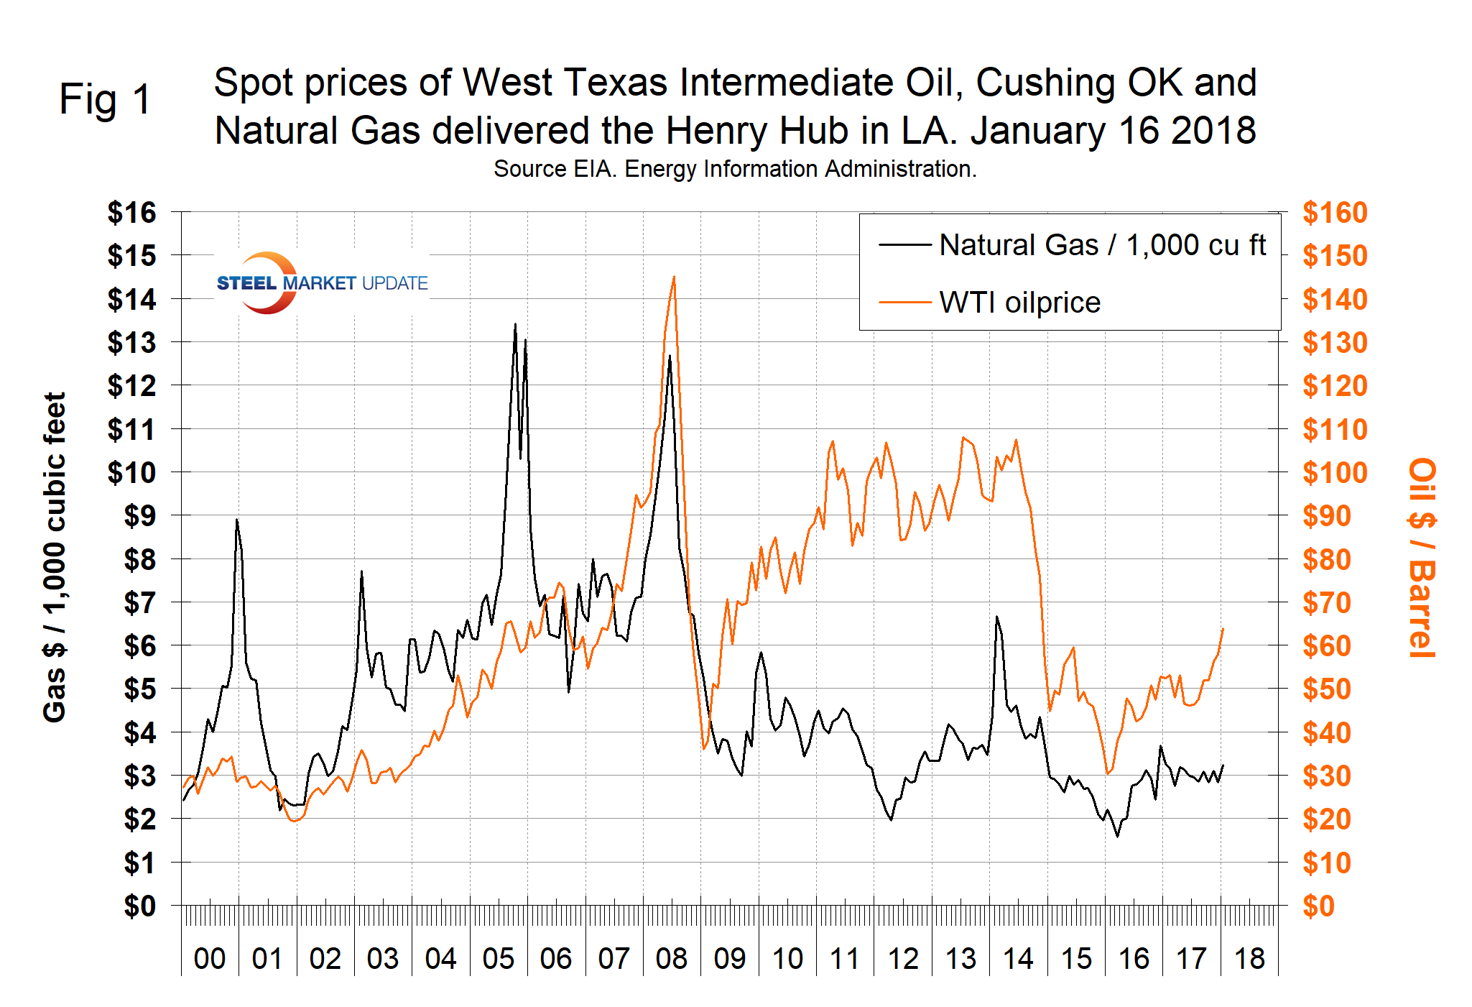
The spot price of West Texas Intermediate (WTI) broke through the $60 level on Dec. 29 for the first time since Dec. 18, 2014. It reached $64.22 on Jan. 12 before falling back to $63.82 on Jan. 16. The total number of operating rigs exploring for oil and gas increased by 15 in the week ending Jan.12, the largest weekly increase since March 12, 2017. The prices of oil and natural gas drive the consumption of energy-related steel products including oil country tubular goods, pipe fittings and well head equipment, among others. About 5.5 million tons of hot rolled sheet was used to make welded tubular goods in 2017 (not including OCTG).
Bloomberg reported the following to Mining.com on Jan. 18: “When OPEC and Russia meet this weekend to review their strategy for clearing a global oil glut, they’ll face an unusual problem. As their output cuts, coupled with robust global demand, tighten the market, crude prices have soared to a three-year high near U.S. $70 a barrel. ‘There is an unintended consequence from this higher price,’ said Ed Morse, head of commodities research at Citigroup, Inc. ‘OPEC are fearful of not only the shale response, but of deep water and of oil-sands from Canada.’ The producers will formally review their accord in June, and may start to wind it down in the second half of the year, Citi’s Morse said. Saudi Arabia and Russia, the biggest producers in the pact, have repeatedly stressed that when the time comes to end the deal it will be done gradually. In the meantime, the pressure to change strategy is likely to ease in coming weeks as oil prices retreat. Crude futures will slip in tandem with a lull in seasonal demand as the need for winter fuels abates, and as hedge funds take profits from the recent rally. ‘For now, with the price strength looking very temporary, I think OPEC will say we’re on our way to getting the market rebalanced, and keep going,’ Morse said. But that resolve may not last all year. ‘There could be an agreement on ramping production back up over the summer.’”
Figure 1 shows historical oil and gas prices since January 2000, with the spot price for West Texas Intermediate staying above the $60 mark this month. Our price and inventory data come from the Energy Information Administration (EIA).
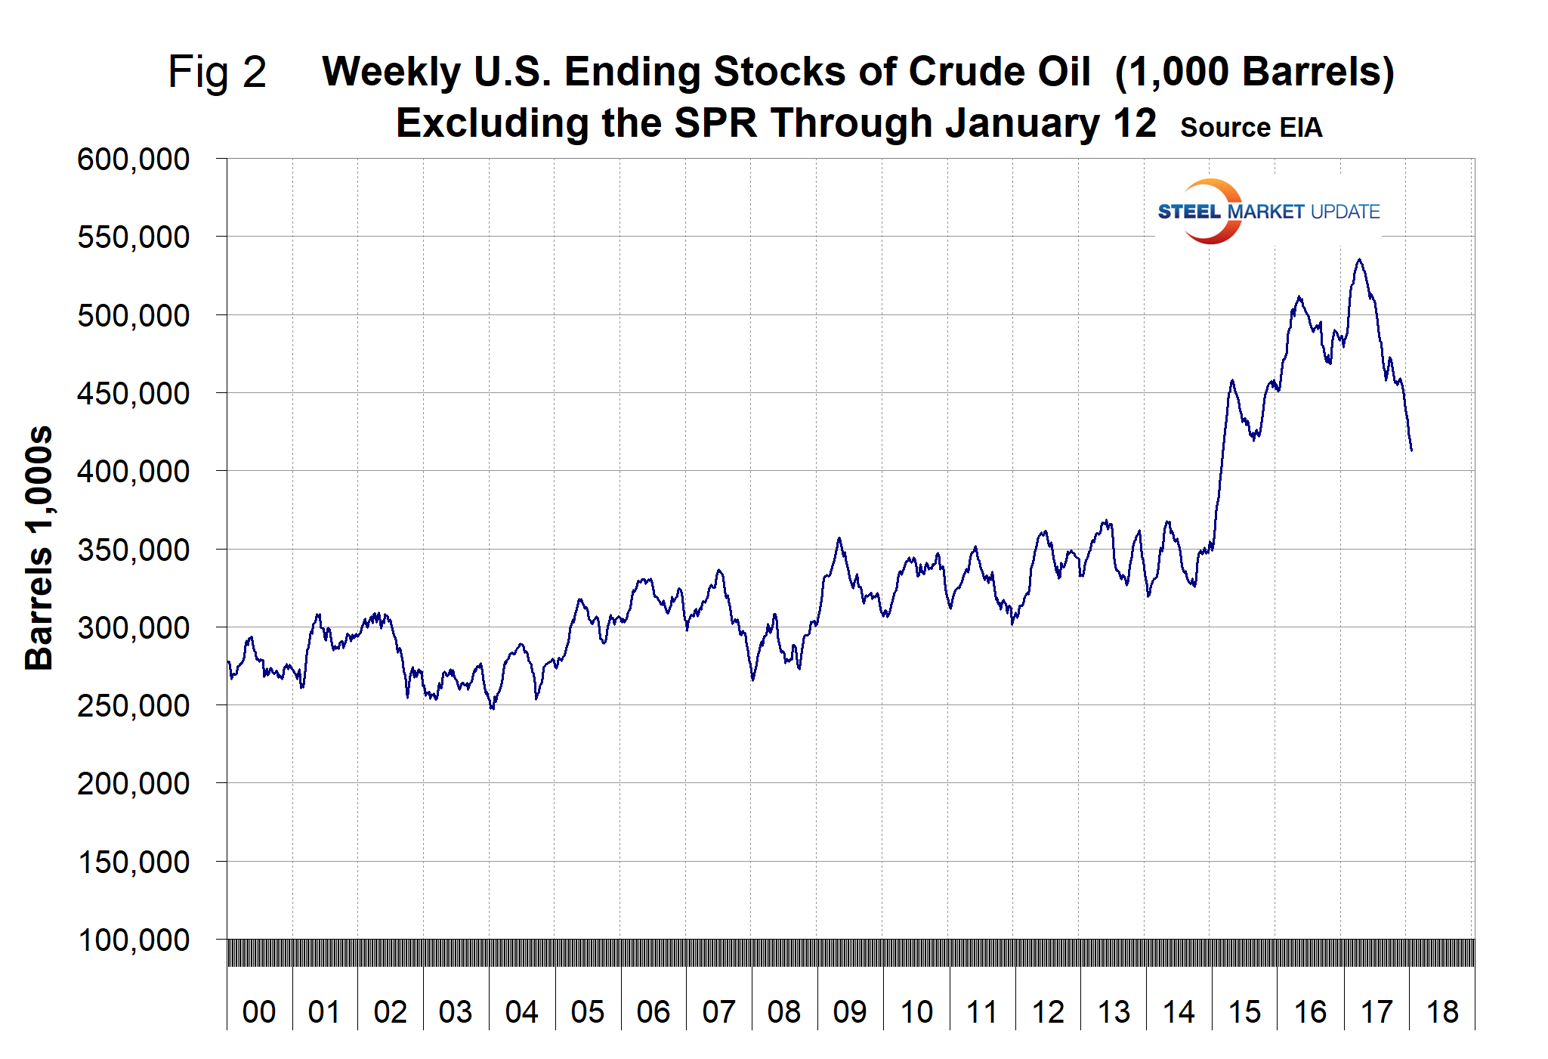
The IEA January monthly report has maintained its 2018 global demand growth forecast, but has also seen a surge in non-OPEC supplies from the U.S. and Canada as prices rise. EIA data shows that U.S. crude oil production stands at 9.75 million barrels per day and is expected to soon exceed 10 million barrels, overtaking OPEC’s Saudi Arabia and rival Russia. The price of WTI at spot $63.82 is now higher than at any time in the last three years. Since March 24, U.S. stocks of crude oil, excluding the strategic petroleum reserve, have been in free fall from 534 million to 413 million barrels on Jan. 12, a reduction of 22.7 percent. On a year-over-year basis, stocks have declined for 26 straight weeks, but remain well above the historical norm (Figure 2).
EIA reported that the price of natural gas at the Henry Hub in Louisiana reached $4.16/1,000 cubic feet on Jan. 5 before falling back to $3.24 on Jan. 12. This was the first time for gas to break through $4.00 since Nov. 2014. EIA expects the share of total U.S. utility-scale electricity generation from natural gas to average about 32 percent in 2017, down from 34 percent in 2016 because of higher natural gas fuel costs and increased generation from renewable energy sources. EIA projects the 2017 share of generation from coal will average 30 percent, about the same as last year. Generation from renewable energy sources other than hydropower will grow from about 8 percent in 2016 to a forecast share of nearly 10 percent in 2018.
The total number of operating rigs in the U.S. on Jan.12 was 939, up from 930 in our last update, but still below the recent peak of 958 on July 28. Figure 3 shows the total number of operating rigs in the U.S. and the weekly change.
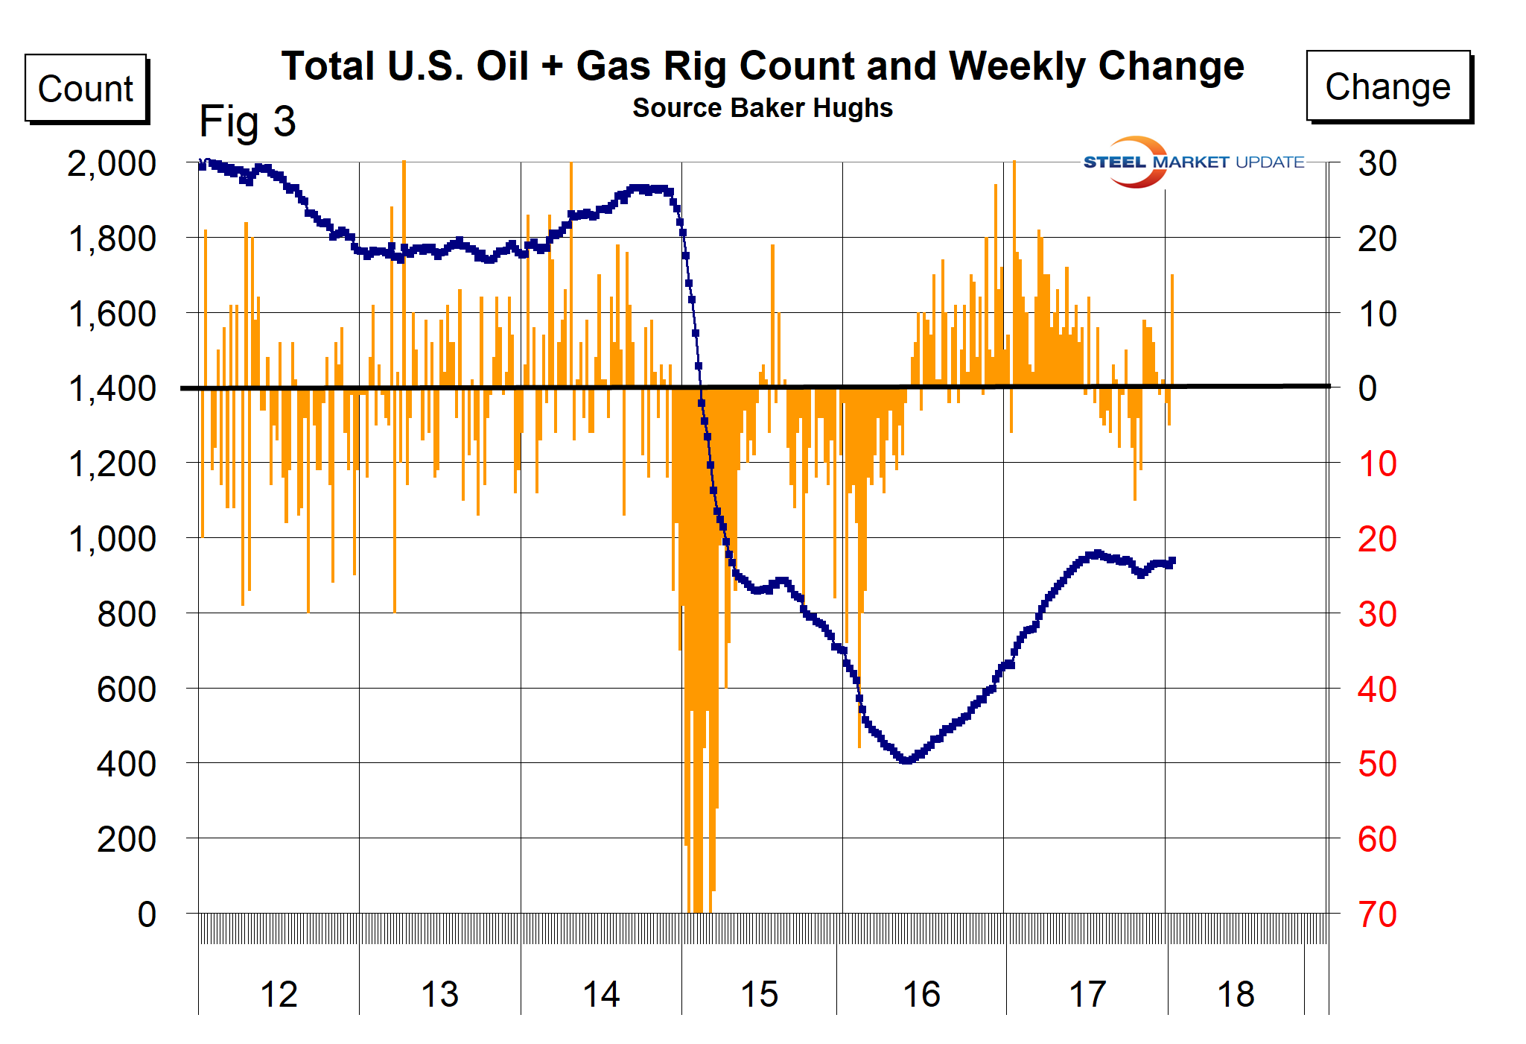
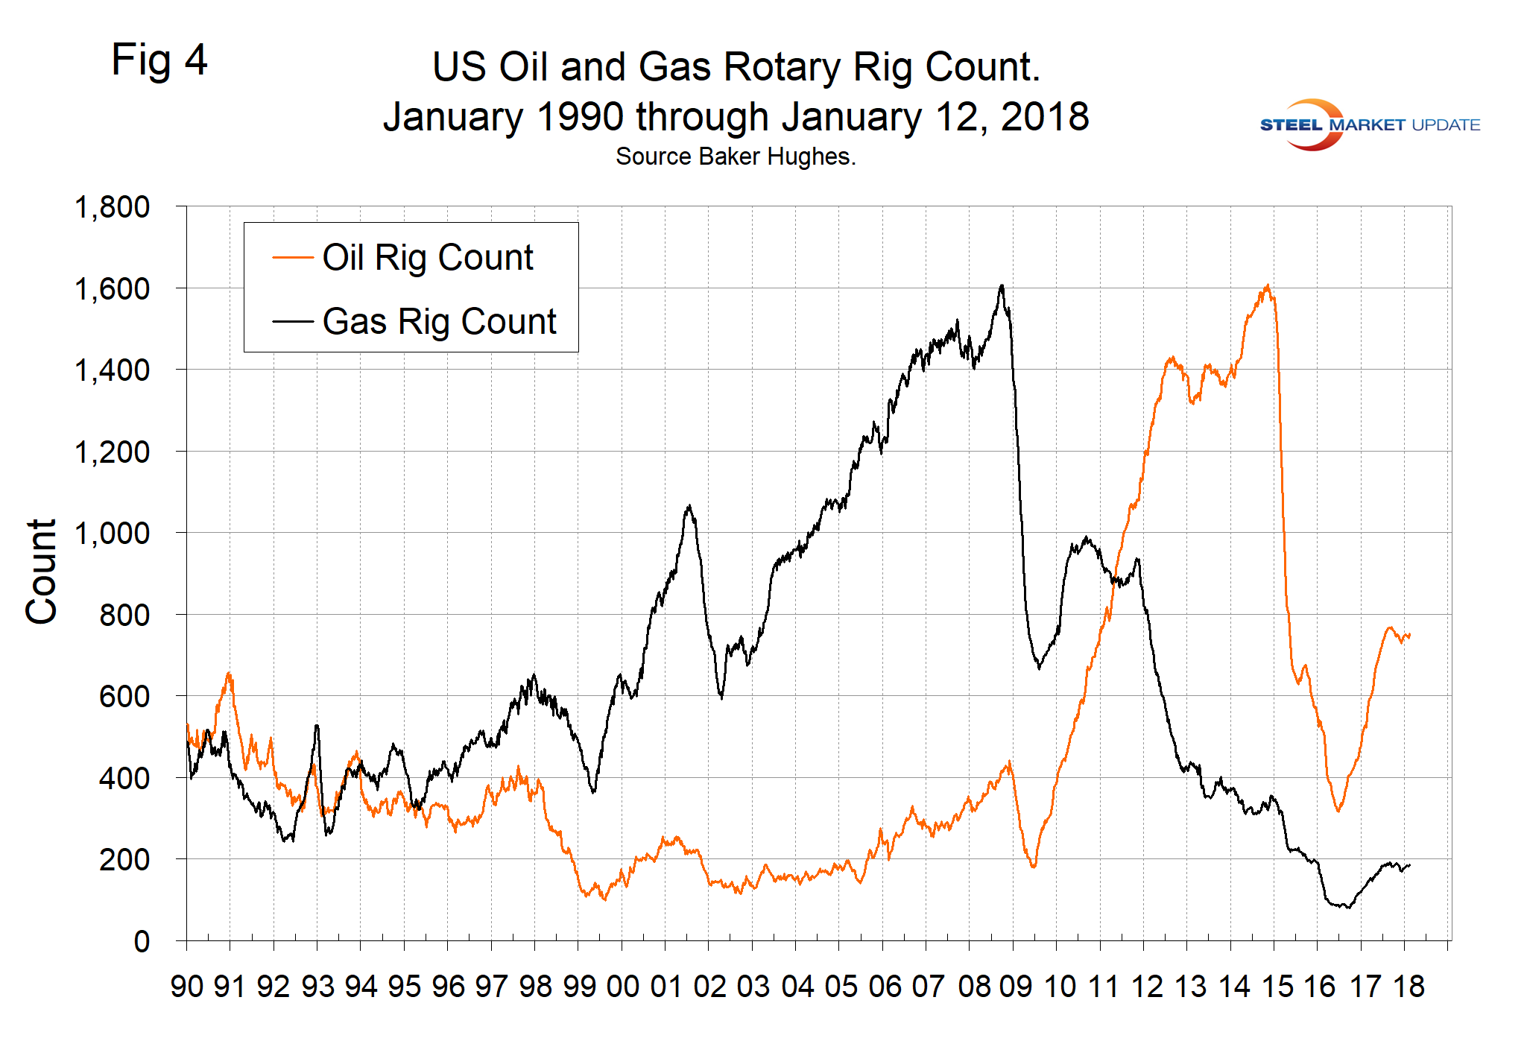
In the week ending Jan.12, the count increased by 15. The oil rig count had a low point of 316 on June 27, 2016, and stood at 752 on Jan.12. The U.S. gas rig count rose from its low point of 81 on Aug. 5, 2016, to 187 on Jan. 12. The year-over-year growth rate of U.S. total rigs was 42.5 percent in the latest data. Figure 4 shows the Baker Hughes U.S. Rotary Rig Counts for oil and gas equipment in the U.S. (explanation below).
On a regional basis in the U.S., the big three states for operating rigs are Texas, Oklahoma and North Dakota. Figure 5 shows the land rig count in those states since 2000 and that non-conventional drilling in North Dakota has declined by 73 percent from its heyday in late 2014. This is not as bad as it sounds because previously drilled and capped wells are being put back on stream.
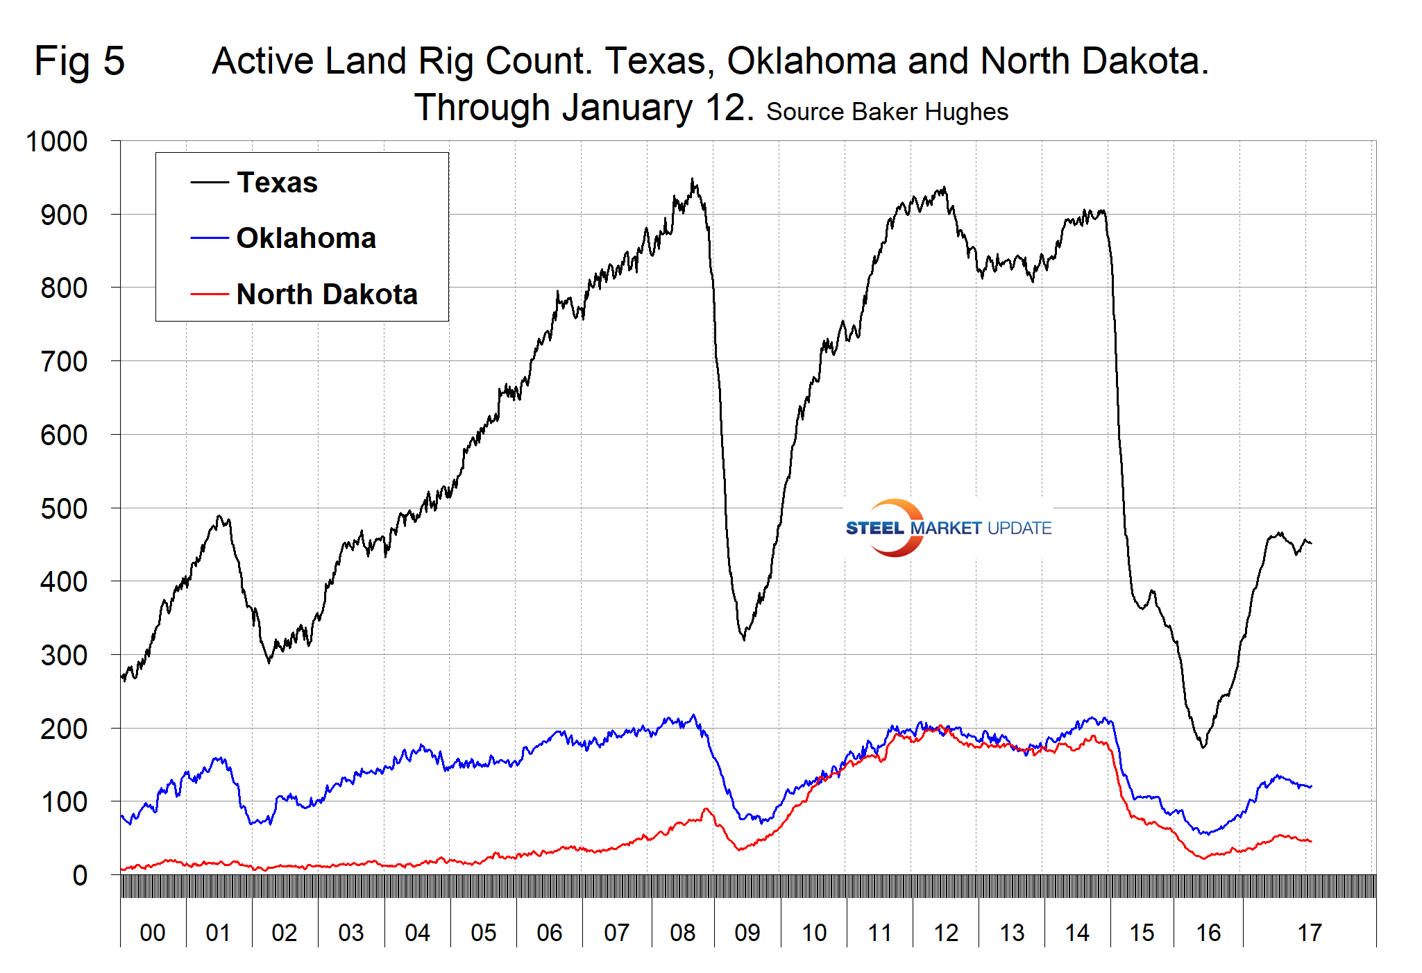
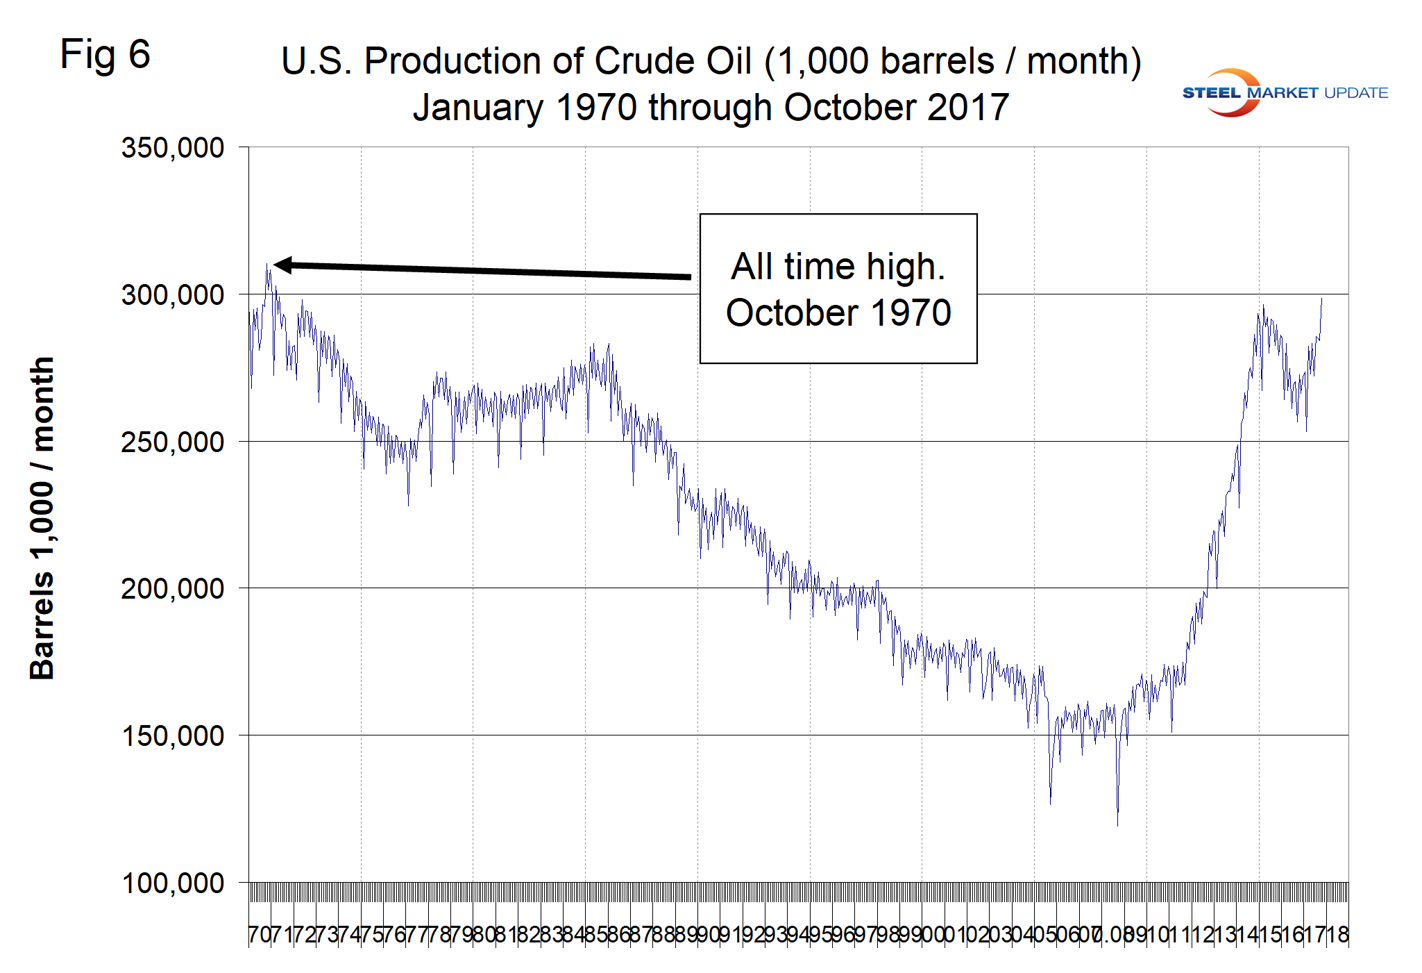
Figure 6 illustrates the monthly U.S. oilfield production of crude from January 1970 through October 2017 with an indication of the all-time high of 310 million barrels that occurred in November 1970. In the week ending Jan.12, production was 9.75 million barrels per day.
On Jan. 2, energy commodities analyst Richard Zeits wrote: “With WTI currently trading at significantly higher price levels, the strong operating momentum in U.S. shales will carry on—and will very likely accelerate—in the first half of 2018. Based on growth dynamics in 2017 and assuming the futures curve holds, it is difficult to imagine U.S. production growing at a slower rate in the coming months. In fact, the pace of growth is almost certain to pick up if oil prices live up to the current futures strip. As a result, by the end of 2018, the U.S. is likely to bypass Russia, the world’s largest producer with ~11 MMb/d in volumes, and become the world’s largest producer of crude oil. The U.S. will also become an increasingly important exporter of light sweet crude, with volumes likely averaging significantly above 2 MMb/d in 2019.”
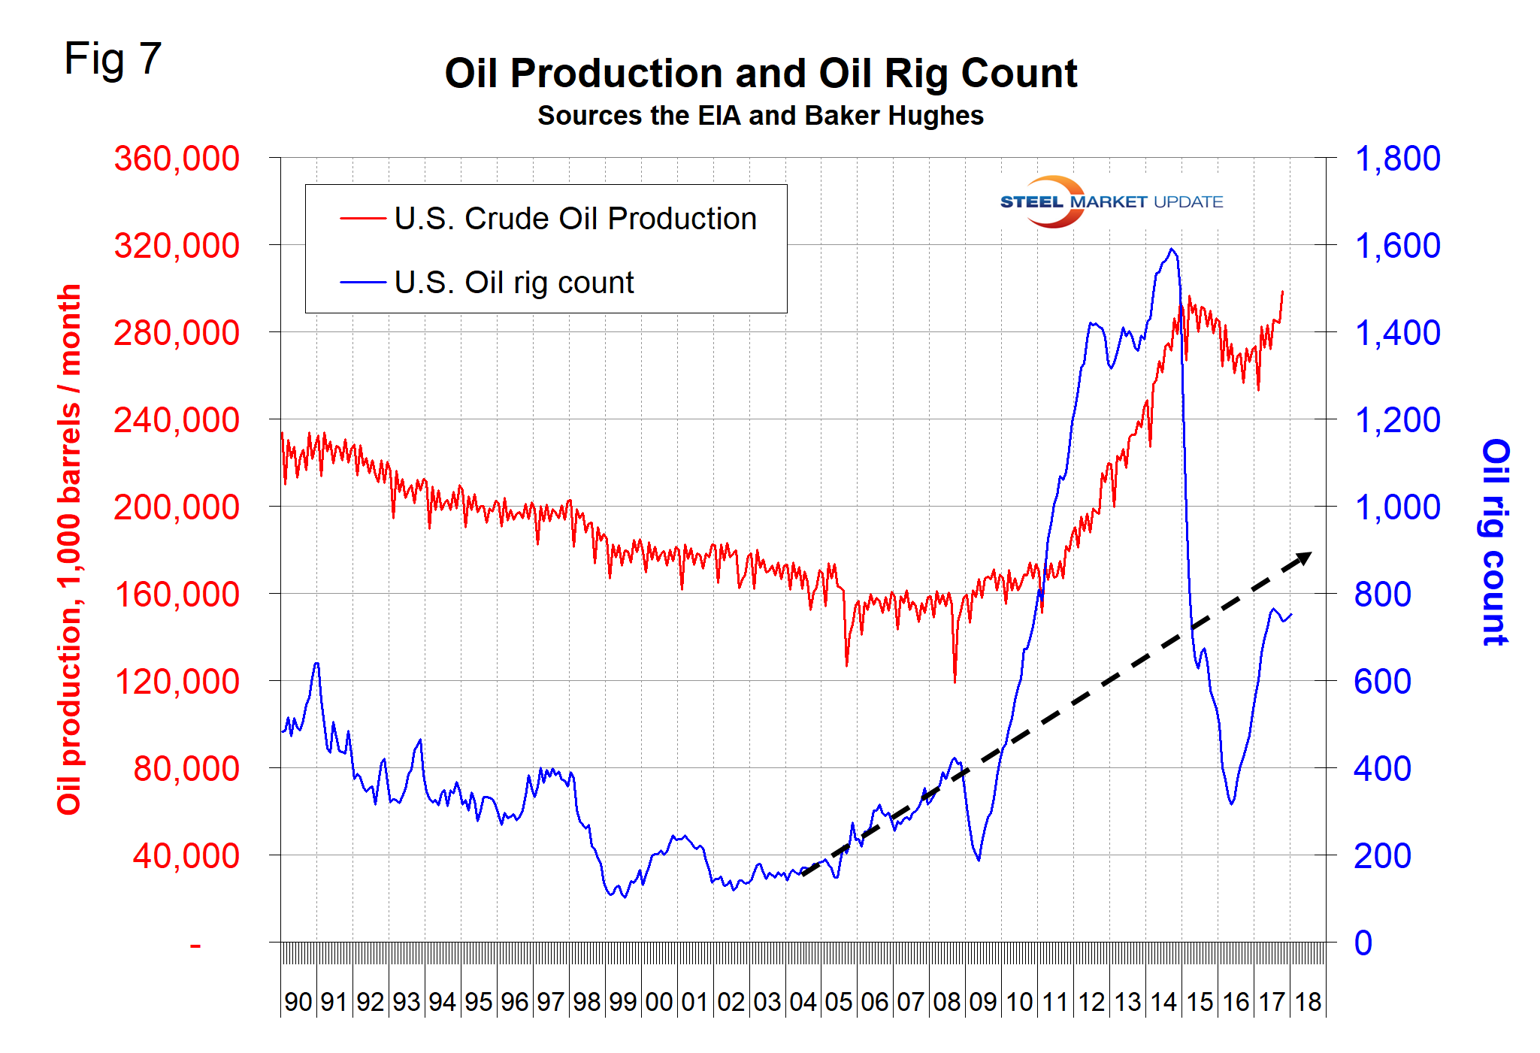
Production in October was 298.7 million barrels, up by 9.6 percent year over year. Figure 7 compares oil production and the oil rig count and shows how the increase in exploratory wells drove production from 2009 through late 2014 when the oil price collapsed. The subsequent decline in production was much less marked and is again increasing. Our take on this is that the huge increase in exploratory oil rigs beginning in 2009 may have been an anomaly and that we won’t see a repeat of the number operating in 2014 for a very long time.
Baker Hughes Rotary Rig Count: This is a weekly census of the number of drilling rigs actively exploring for or developing oil or natural gas in the United States. Rigs are considered active from the time they break ground until the time they reach their target depth and may be establishing a new well or sidetracking an existing one. The Baker Hughes Rotary Rig count includes only those rigs that are significant consumers of oilfield services and supplies.


