

Market Data

November 28, 2017
Energy Market Review: Oil Holds Steady Above $55
Written by Peter Wright
The price of West Texas Intermediate oil has been above $55 per barrel for all of November.
On Nov. 3, the spot price of West Texas Intermediate (WTI) closed above $55 per barrel where it stayed through the latest data on Nov. 22. The number of operating rigs exploring for both oil and natural gas increased for the third consecutive week on Nov. 22. The prices of oil and natural gas drive the consumption of energy-related steel products including oil country tubular goods, pipe fittings and well head equipment, among others. A significant volume of hot rolled coil is used to make welded tubular goods.
Figure 1 shows historical oil and gas prices since January 2000.
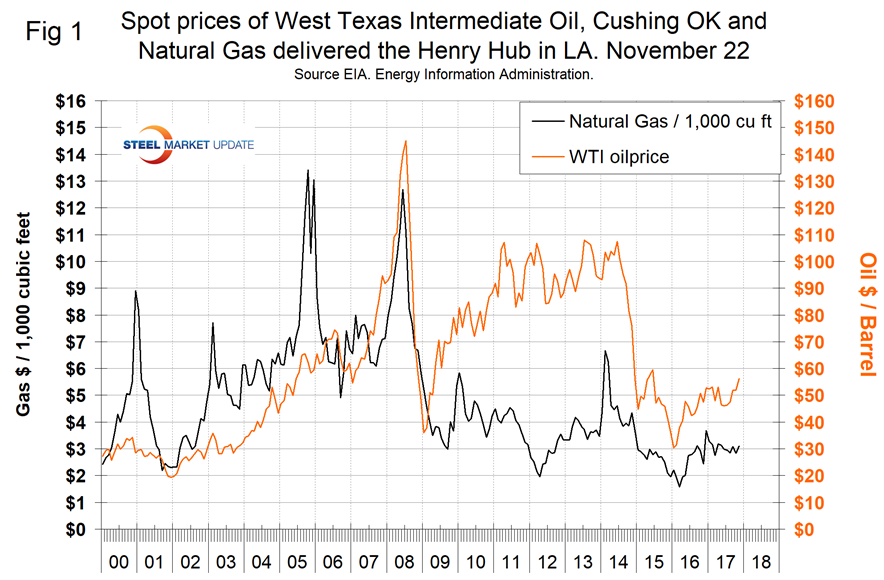
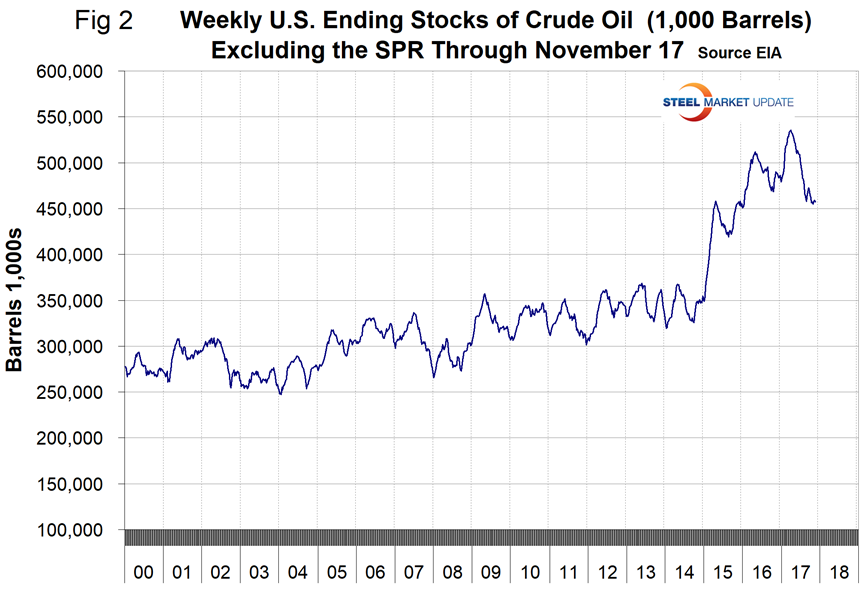
The price of WTI at spot $56.21 is now higher than at any time since June 2015. Our price and inventory data comes from the Energy Information Administration (EIA). Since March 24, U.S. stocks of crude oil, excluding the strategic petroleum reserve, have declined from 534 million barrels to 457 million on Nov. 17, a reduction of 14.4 percent. On a year-over-year basis, stocks have declined for 18 straight weeks; however, they are still well above the historical norm (Figure 2).
On Nov. 20 (Monday), Dean Popplewell, a macroeconomic analyst, wrote, “Investors seem reluctant to take on big new positions ahead of an OPEC meeting at the end of the month at which producers are expected to decide whether to continue output cuts aimed at supporting prices. Brent crude futures are at +$62.47 per barrel, down -25c or -0.4 percent from Friday’s close, while U.S. West Texas Intermediate crude futures are at +$56.57 a barrel, up just +2c. OPEC, along with a group of non-OPEC producers led by Russia, have been restraining output since the start of this year in a bid to end a global supply overhang and prop up prices. The deal expires in March 2018. OPEC is expected to agree to an extension, although there are doubts about the willingness of some participants to continue to restrain output.”
The price of natural gas on Nov. 17 at the Henry Hub in Louisiana was $3.10/1,000 cu.ft. This was 26 cents higher than October, but the same as in September.
The total number of operating rigs in the U.S. on Nov. 22 was 923, an increase of 25 in the latest three weeks, but still below the recent peak of 958 on July 28. Figure 3 shows the total number of operating rigs and the weekly change.
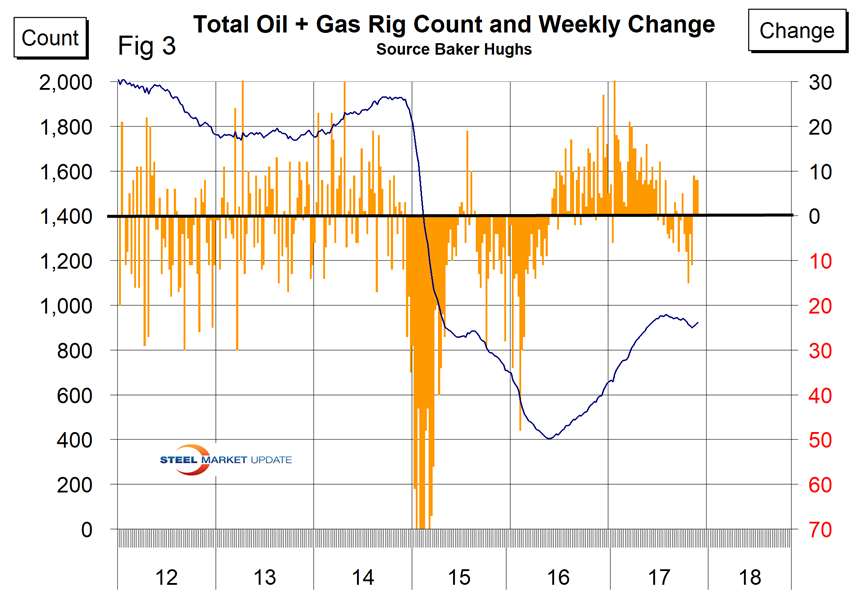
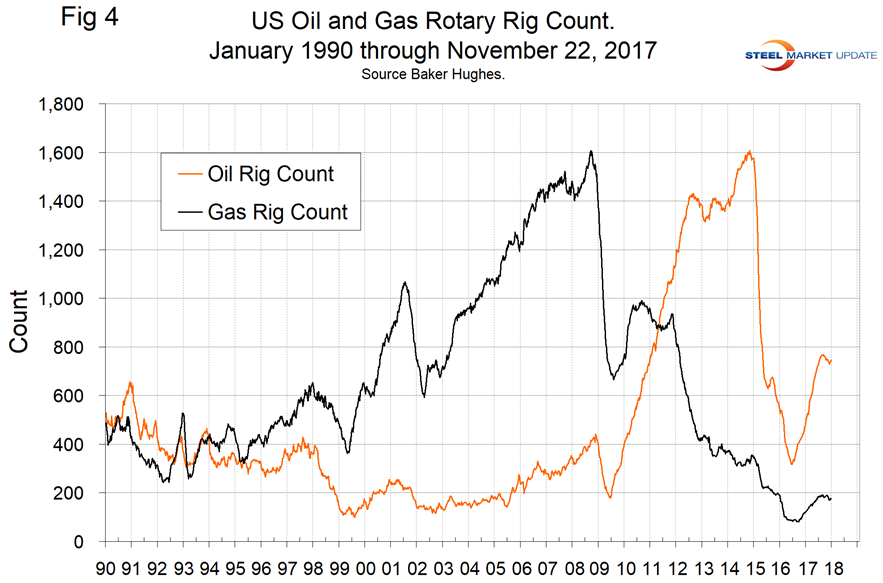
In the week ending Nov. 22, the total count increased by eight as the oil rig count rose by nine and gas fell by one. The oil rig count had a low point of 316 on June 27 last year and stood at 747 on Nov. 22. The U.S. gas rig count rose from its low point of 81 on Aug. 5 last year to 176 on Nov. 22. The year-over-year growth rate of U.S. total rigs was 55.6 percent in the latest data. Figure 4 shows the Baker Hughes U.S. Rotary Rig Counts for oil and gas equipment in the U.S. (explanation below).
On a regional basis in the U.S., the big three states for operating rigs are Texas, Oklahoma and North Dakota. Figure 5 shows the land rig count in those states since 2000, and that non-conventional drilling in North Dakota was down by 73 percent from its heyday in late 2014. This is not as bad as it sounds because previously drilled and capped wells are being put back on stream.
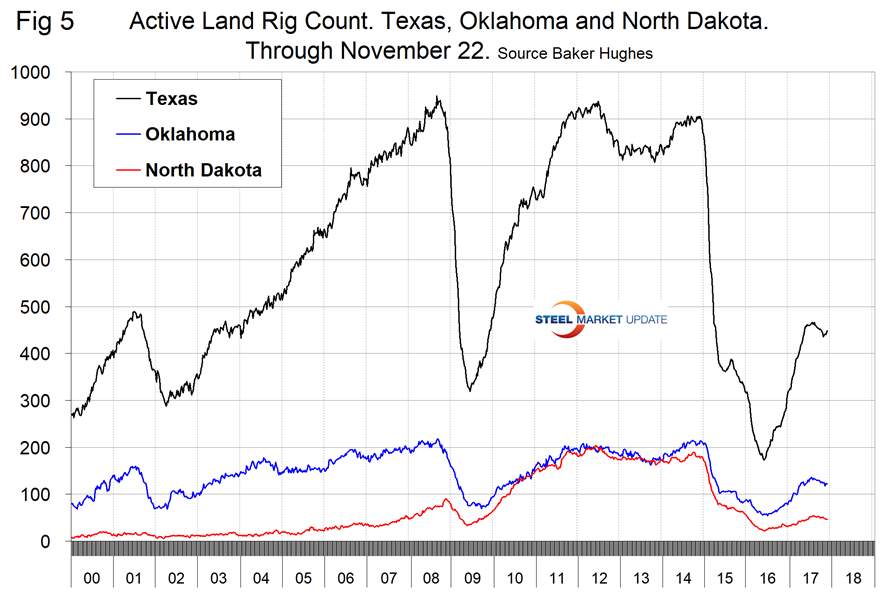
Figure 6 illustrates the monthly U.S. oilfield production of crude from January 2005 through August 2017 with an indication of the all-time high of 310 million barrels that occurred in November 1970.
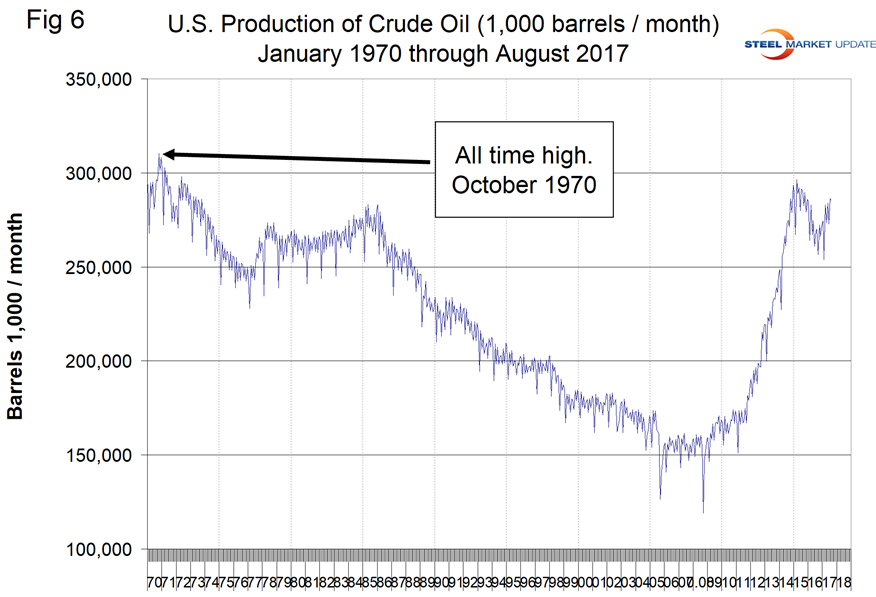
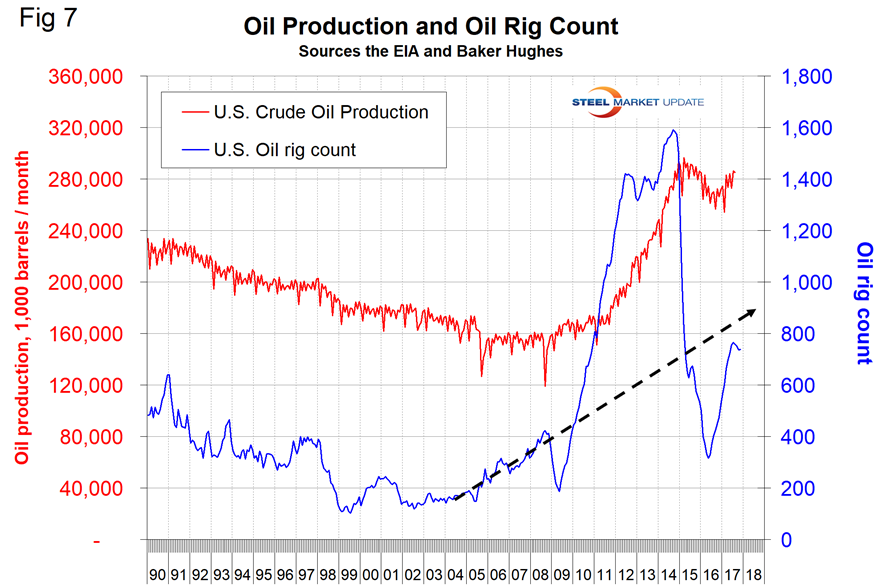
Production in August 2017 was 285 million barrels. This month, we have developed a new chart shown here as Figure 7. It compares oil production and the oil rig count and shows how the increase in exploratory wells drove production from 2009 through late 2014 when the oil price collapsed. The subsequent decline in production was much less marked and is again increasing. Our take on this is that the huge increase in exploratory oil rigs beginning in 2009 may have been an anomaly and that we won’t see a repeat of the number operating in 2014 for a very long time.
About the Baker Hughes Rotary Rig Count: This is a weekly census of the number of drilling rigs actively exploring for or developing oil or natural gas in the United States. Rigs are considered active from the time they break ground until the time they reach their target depth and may be establishing a new well or sidetracking an existing one. The Baker Hughes Rotary Rig count includes only those rigs that are significant consumers of oilfield services and supplies.


