

Market Data

November 2, 2017
Lead Times Stretch – Some Products More than Others
Written by John Packard
After price increase announcements, it is important to follow steel mill lead times (and other keys) as a way of seeing if the increases are being seriously considered by steel buyers. The farther and faster lead times move out, the more support for the price increases announced by the domestic steel mills.
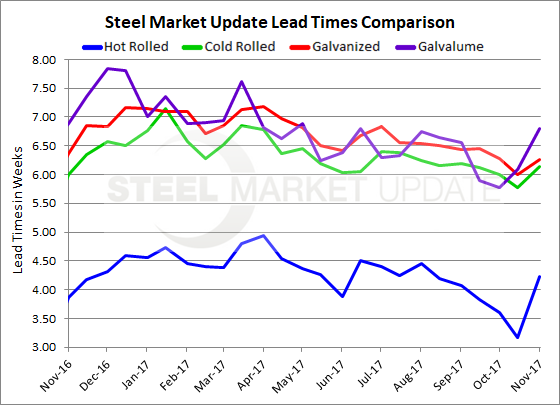
Steel Market Update (SMU) conducted an analysis of the flat rolled steel markets and market trends over the course of the past four days. One of the key indicators produced out of our analysis is the change in lead time trends in hot rolled, cold rolled, galvanized and Galvalume steels. Respondents to this week’s questionnaire noted that lead times on each product were higher than what was reported during the middle of October.
Hot rolled lead times jumped a full week as a combination of maintenance and reaction to higher steel prices drove buyers to place more HRC orders. Our last analysis, which was produced the week of Oct. 16, reported HRC lead times as averaging a little more than 3 weeks (3.16 weeks). This week, that average has grown to 4.22 weeks. One year ago, HRC lead times averaged slightly less than 4 weeks (3.86 weeks) and steel prices at that point in time were on the rise.
Cold rolled lead times also moved out about one-half of a week from mid-October to this week. In mid-October, lead times averaged 5.77 weeks, and this week our respondents reported CRC lead times as being slightly longer than six weeks (6.14 weeks). Last year, CRC lead times averaged six weeks.
Galvanized lead times only moved out by one-quarter of a week compared to mid-October. In mid-October, GI lead times averaged six weeks. This week, we calculated the average as 6.26 weeks. Last year, GI lead times averaged 6.36 weeks.
Galvalume lead times moved out by approximately three-quarters of a week compared to mid-October. Our respondents pegged AZ lead times as averaging 6.80 weeks. One year ago, AZ lead times were about the same, averaging 6.88 weeks.
Note: These lead times are based on the average from manufacturers and steel service centers who participated in this week’s SMU market trends analysis. Our lead times do not predict what any individual may get from any specific mill supplier. Look to your mill rep for actual lead times. Our lead times are meant only to identify trends and changes in the marketplace. To see an interactive history of our Steel Mill Lead Times data, visit our website here.


