Market Segment

October 18, 2017
Service Center Steel Shipments Stay on Track in September
Written by Peter Wright
Service centers’ daily steel shipments in September were 0.9 percent higher than in August, matching the average since 2009. Therefore, the latest numbers were exactly on the historical track for this time of year, according to Steel Market Update’s analysis of Metals Service Center Institute data (MSCI).
Carbon steel shipments were 144,400 tons per day in September and days on hand on the 30th were 50.6, which was close to the 50.3 at the end of July and 50.4 at the end of August. In this analysis, we began to report days on hand for the first time in August. All previous SMU updates reported months on hand. The problem with MoH is that it is influenced by the number of shipping days, therefore another variable is introduced. In months with a high number of shipping days, monthly shipments are elevated, which reduces the numerical value of inventory divided by shipments. In months with few shipping days, the reverse is the case. This is a big deal because shipping days can be as low as 18 and as high as 23. This variable is eliminated by considering inventory divided by daily shipments.
Intake and Shipments
In September, total carbon steel intake at 149,100 tons per day (t/d) was exactly the same as in August and was 4,700 tons more than shipments. This was the fourth month of surplus after three months of deficit. Total sheet products had an intake surplus of 8,200 tons. This was the fifth month of surplus after three successive months of deficit. In September, the other four product groups considered here all had an intake deficit.
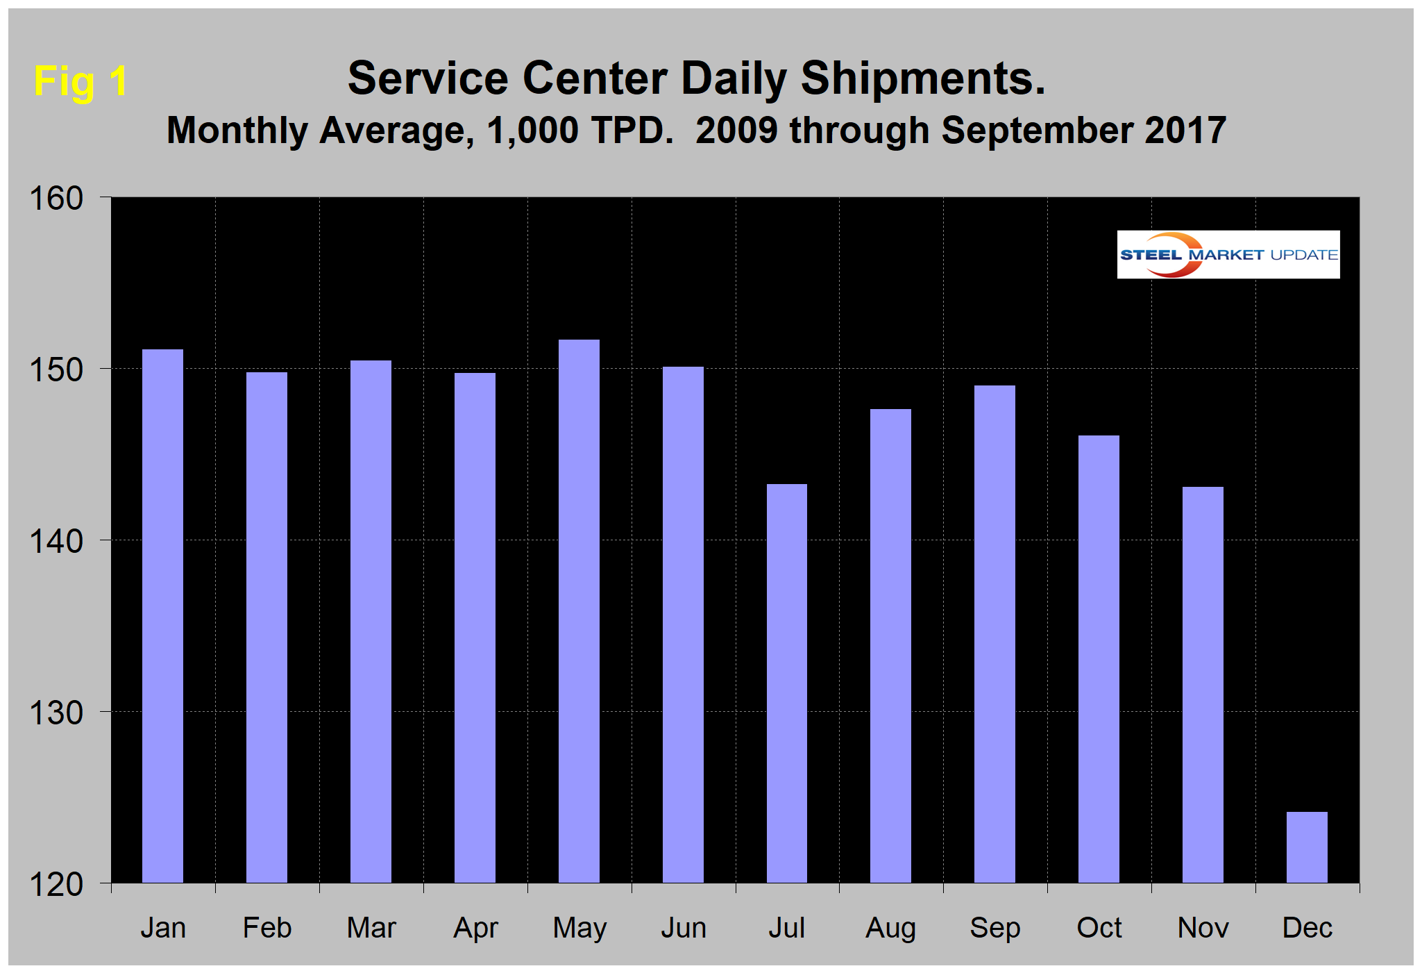
Total daily carbon steel shipments increased from 143,100 tons in August to 144,400 tons in September. MSCI data is quite seasonal, and we need to eliminate that effect before commenting in detail on an individual month’s result. Figure 1 demonstrates this seasonality and why comparing a month’s performance with the previous month can be misleading, particularly in July and the fourth quarter. We can expect shipments to decrease in the final three months of the year.
In the commentary below, we report year-over-year (y/y) changes to eliminate seasonality and provide an undistorted view of market direction. Table 1 shows the performance by product in September compared with the same month last year and with the average daily shipments for this and the two previous months of September.
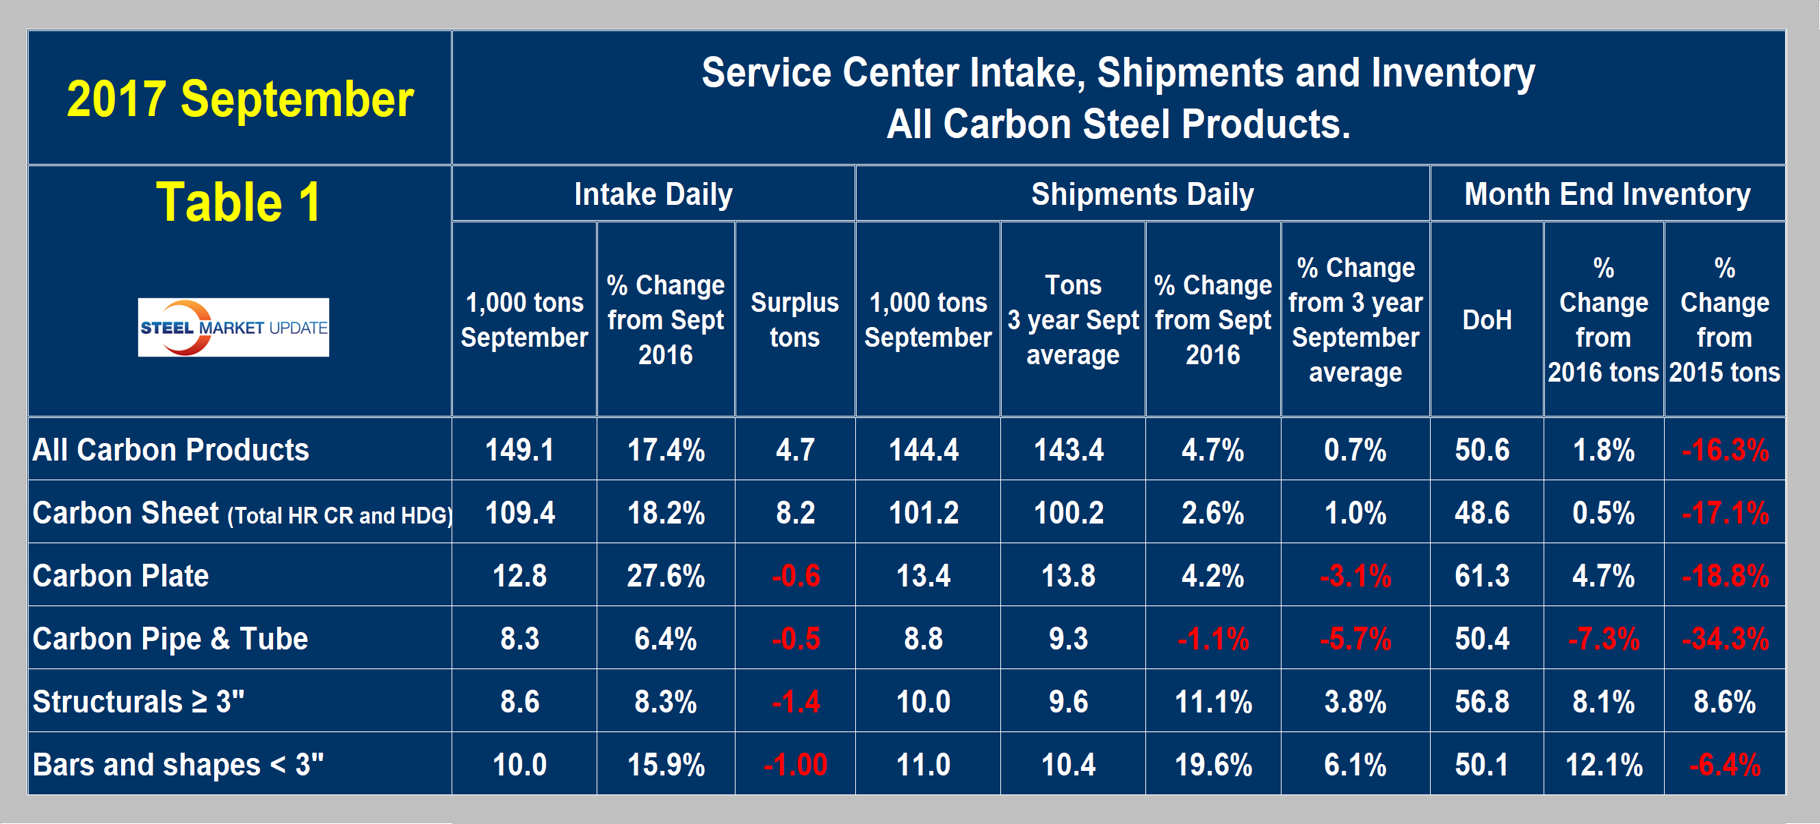
We then calculate the percent change between September 2017 and September 2016 and with the most recent three-year September average. September this year was up by 4.7 percent from September 2016 and up by 0.7 percent from the three-year September average. The fact that the y/y growth comparison is better than the three-year comparison suggests that momentum is positive, and in fact we now have four straight months where the y/y change has improved. Shipments of all products except tubulars were up from September last year.
Figure 2 shows the long-term trend of daily carbon steel shipments since 2000 as three-month moving averages. (In our opinion, the quickest way to size up the market is the brown bars in Figures 2, 3, 4, 5 and 6, which show the percentage y/y change in shipments by product.) In January, on a 3MMA basis, there was positive y/y growth of 0.07 percent, which improved to 6.2 percent in April before declining to positive 2.8 percent in September. These were the first positive y/y results since September 2015.
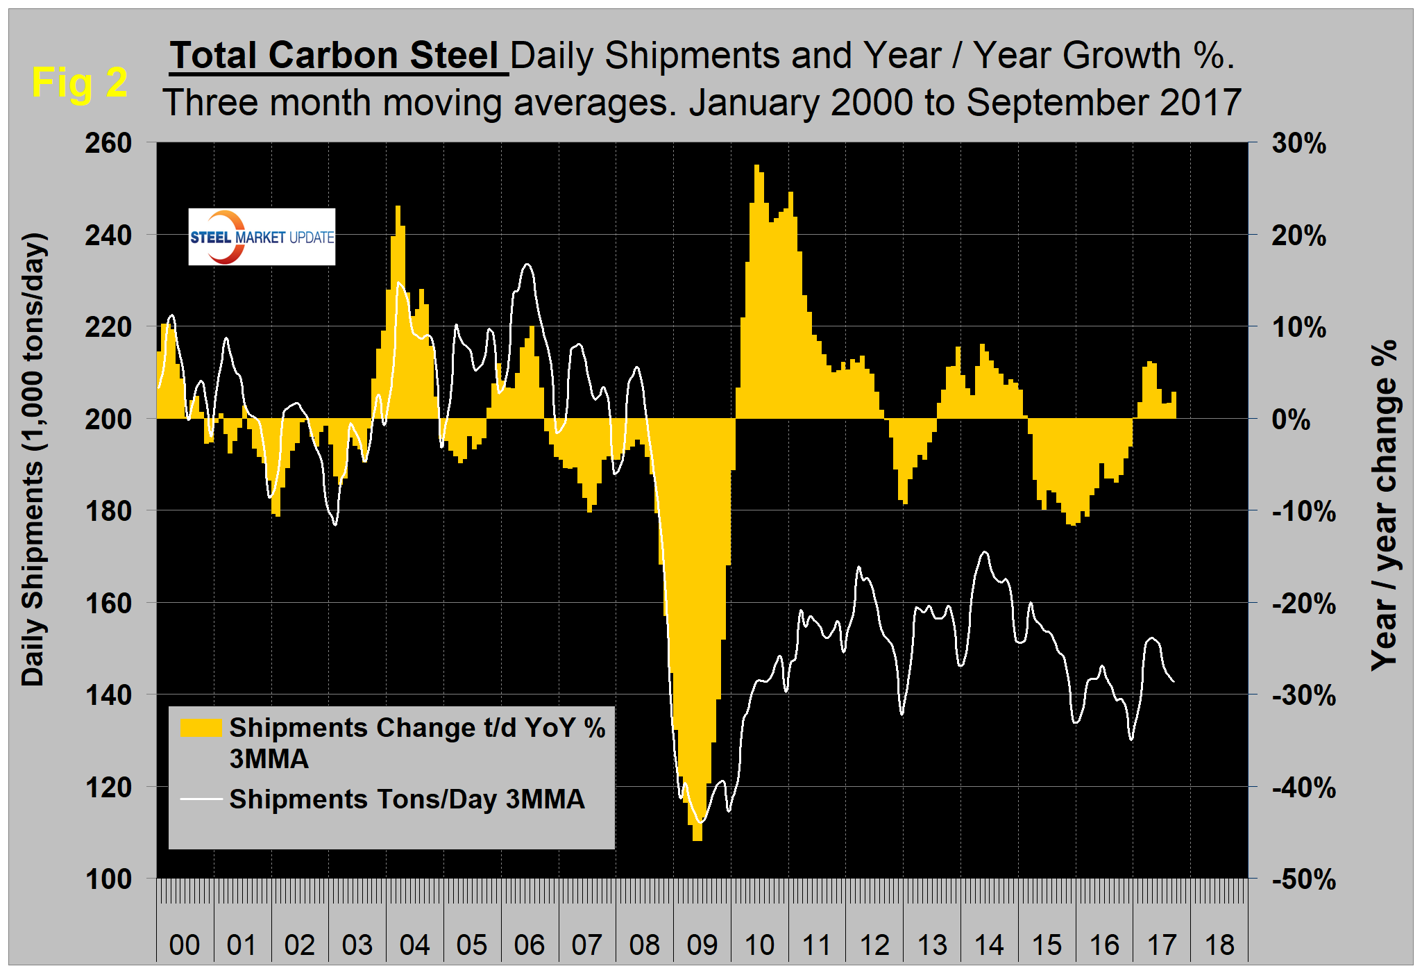
Figure 3 shows monthly long product shipments from service centers as a 3MMA with y/y change. Growth has improved this year and is now the highest it has been since late 2010. The six months through September all exceeded a 10 percent y/y growth rate. Figures 4, 5 and 6 show the 3MMA of daily shipments and the y/y growth for sheet, plate and tubular goods, respectively.
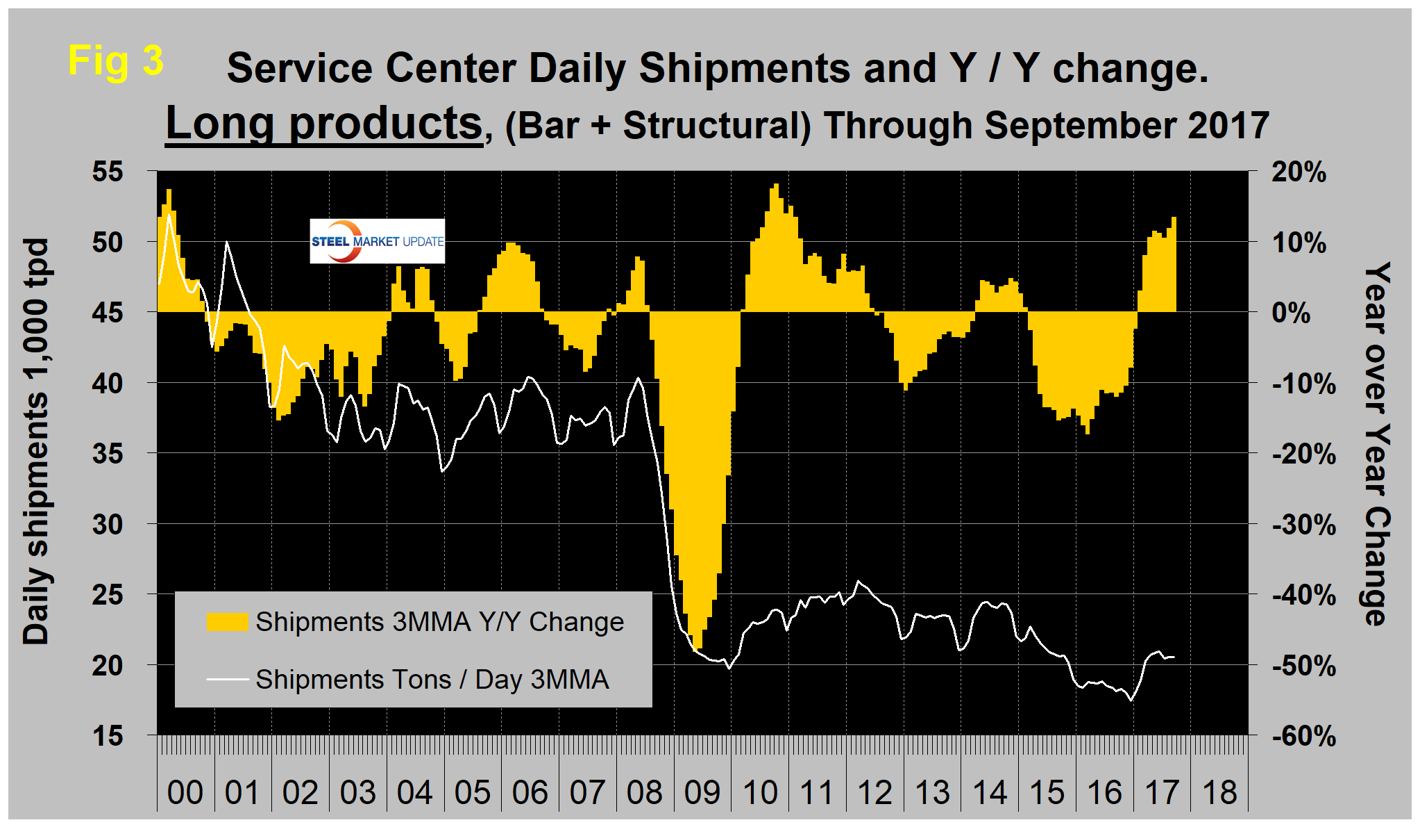
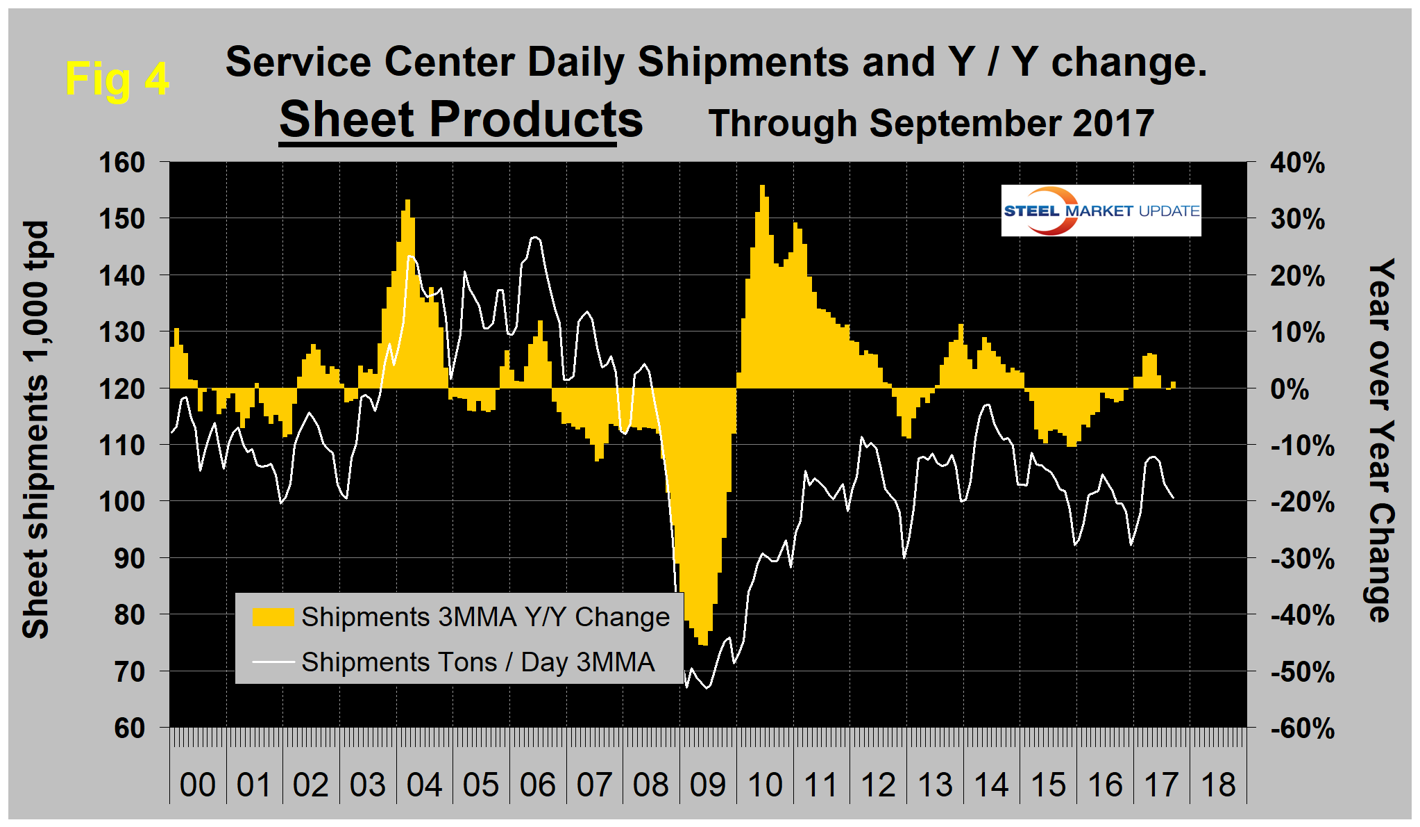
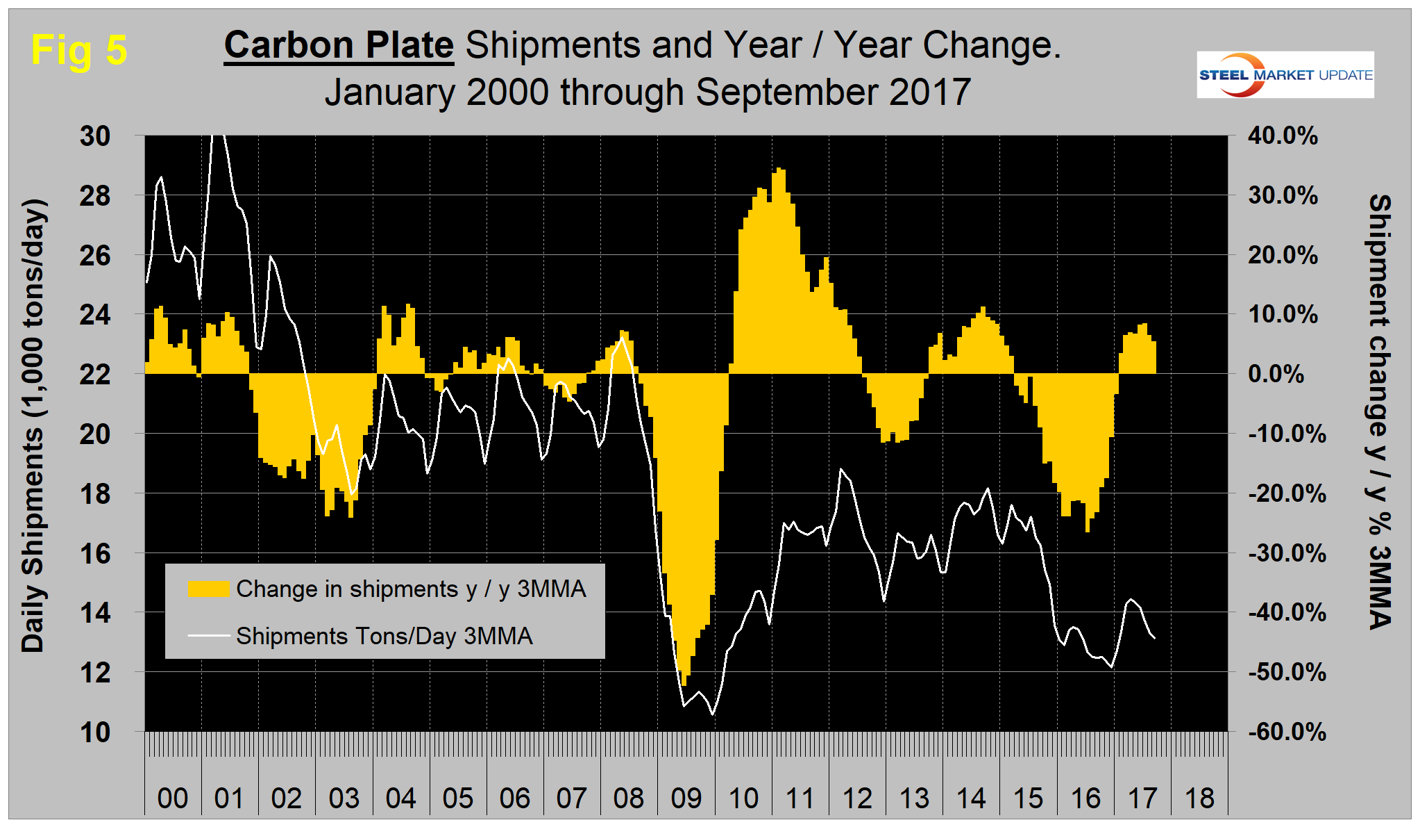
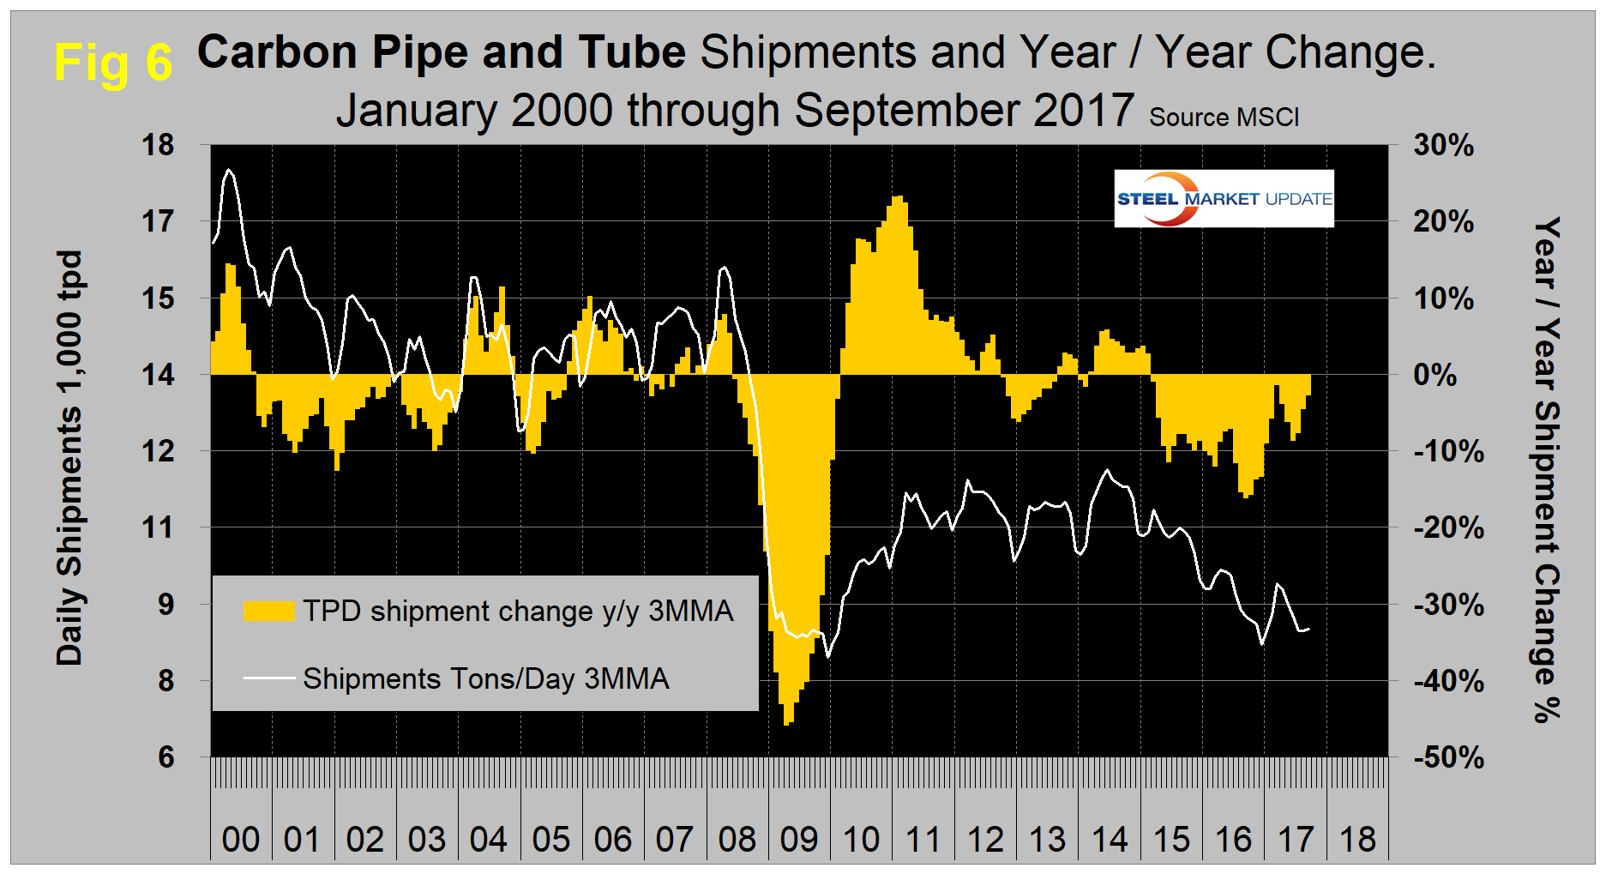
Plate performed much worse than sheet in 2015 and 2016. This year plate has begun to close the gap. Pipe and tube have performed very poorly since early 2015, which exactly coincided with the decline in rig count. The rig count is currently almost double what it was this time last year, but so far this has not translated into improved shipments of pipe and tube from service centers.
In 2006 and 2007, the mills and service centers were operating at maximum capacity. Figure 7 takes the monthly shipments by product and indexes them to the average for 2006 and 2007 to measure the extent to which shipments of each product have recovered.
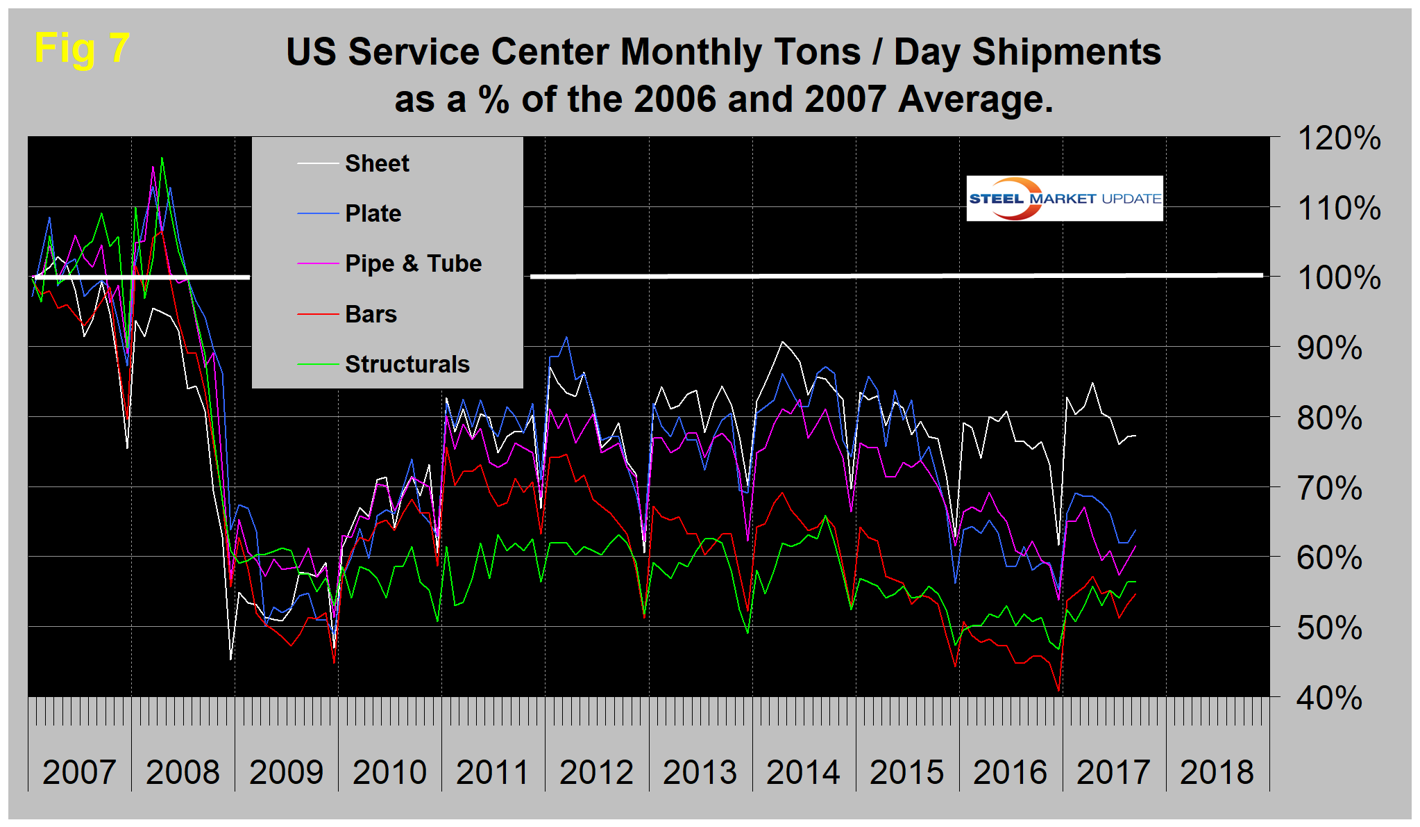
Each year, all products experience the December collapse and January pickup. In September, the total of carbon steel products was 68.0 percent of the average monthly shipping rate that occurred in 2006 and 2007. Structurals and bar were 56.3 percent and 54.7 percent, respectively. Sheet was at 77.3 percent, plate at 63.8 percent and tubulars at 61.5 percent.
Inventories
March closed with months on hand (MoH) of 1.94 for all carbon steel products, which was the lowest level in 13 years (since August 2004). This anomaly partly resulted from 23 shipping days, which is the maximum that ever occurs. We have now removed that effect as described above. Compared to the end of September last year, days on hand (DoH) were down from 52.0 to 50.6. On a tonnage basis, total carbon steel inventories at the end of September were up by 1.8 percent year over year, but down by 16.3 percent compared to the end of September 2015. Compared to 2016, all products except tubular goods had an inventory tonnage increase. Figure 8 shows the DoH by product monthly since September 2009.
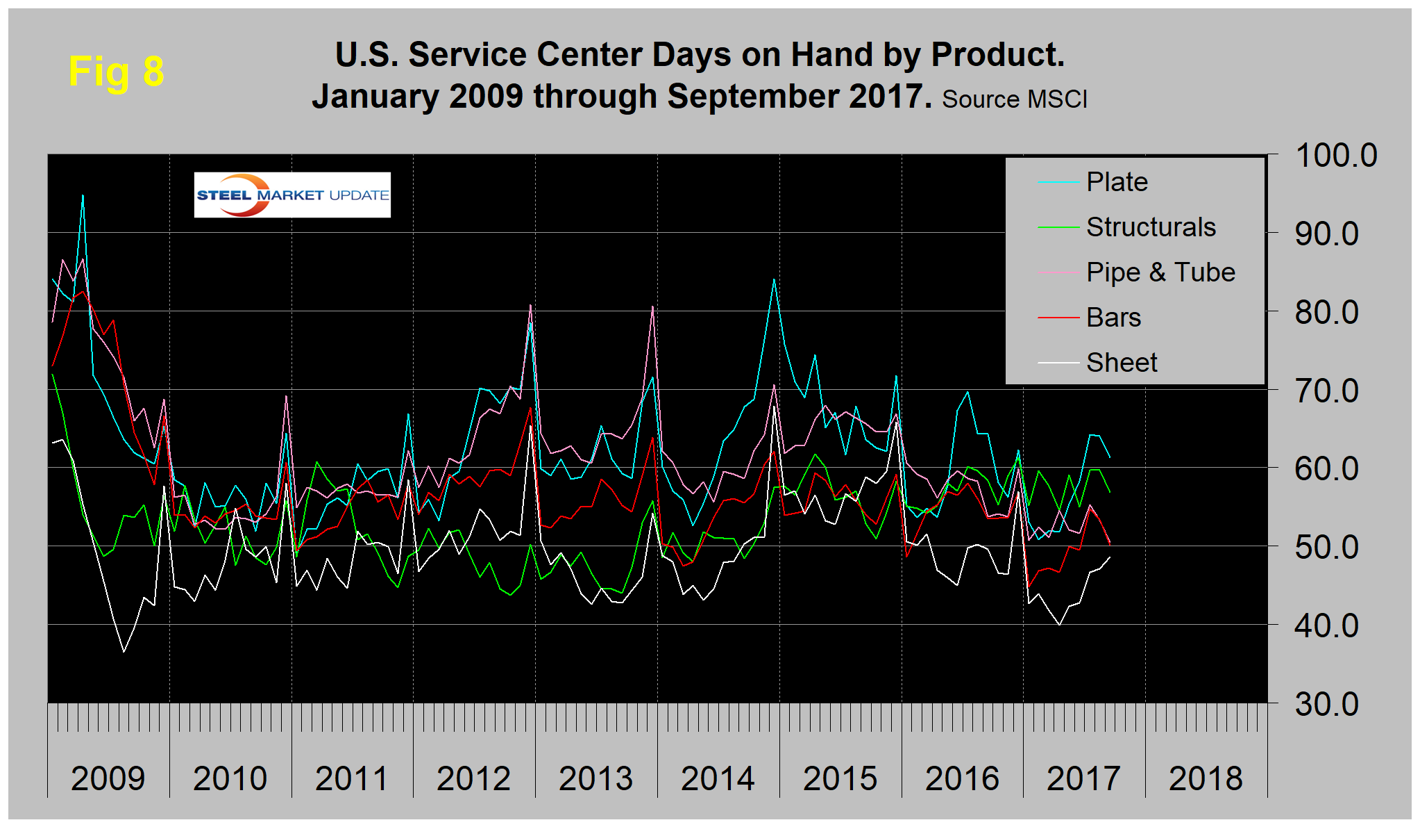
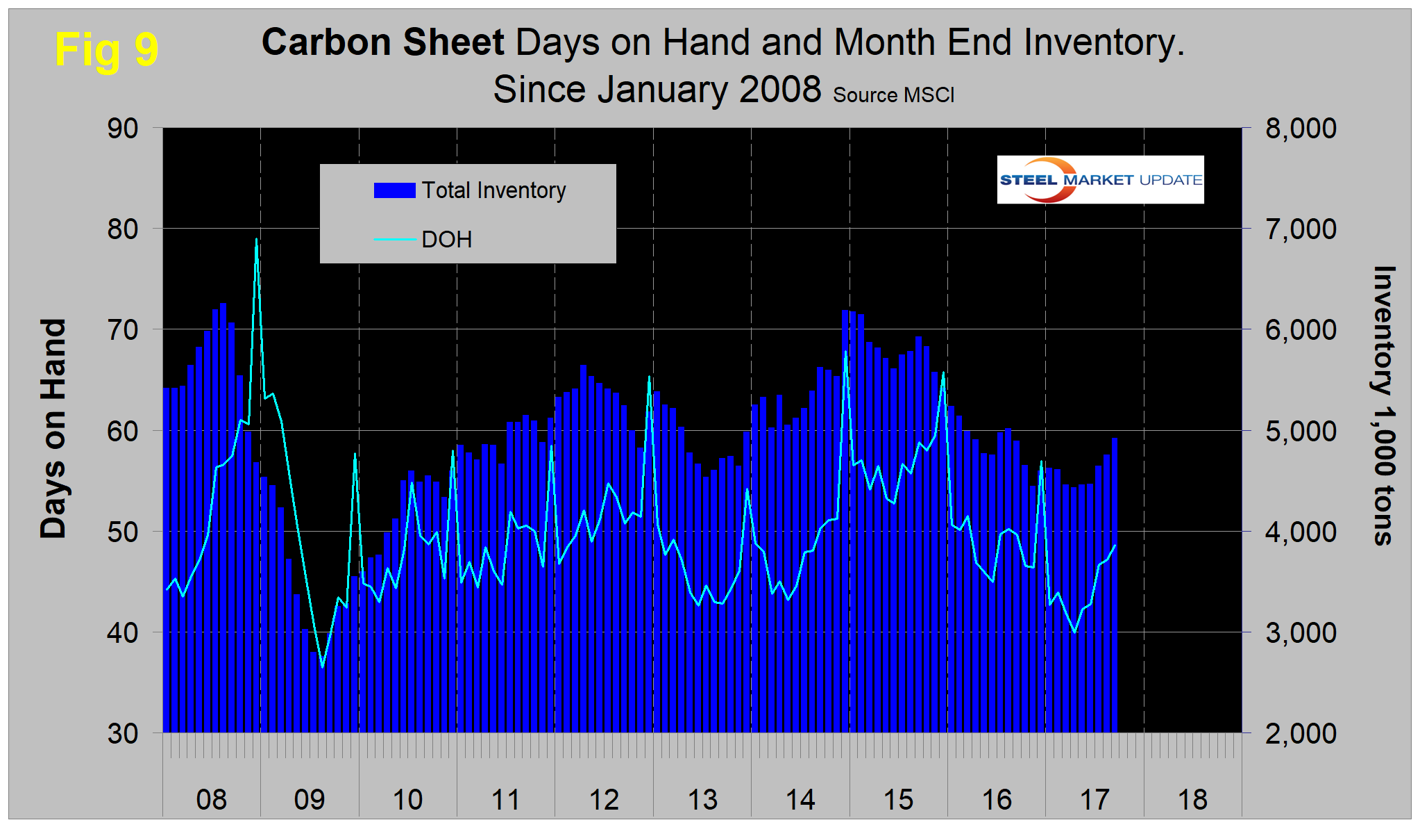
Figure 9 shows both the month-end inventory and days on hand since September 2008 for total sheet products. The total inventory tonnage of sheet products has been in decline since the end of 2014 with two spikes along the way and the possibility of a third one developing now.
SMU Comment: In Figures 2, 3, 4, 5 and 6, the white lines show t/d shipments on a 3MMA basis. In the first few months of 2017, there was the normal seasonal increase in total shipments as December moved out of the rolling three-month picture. However, there has been a big difference between products. Long products have enjoyed double-digit growth in the last six months, but at the other extreme tubulars have contracted every month for two and a half years. Plate has had quite strong growth this year and has performed much more robustly than sheet, which had slightly negative y/y growth in both June and July. These observations don’t jibe with our analysis of AISI and Commerce Department data. Figure 10 shows the total supply to the market of long and flat products based on AISI shipment and import data through August, which is the latest data available.
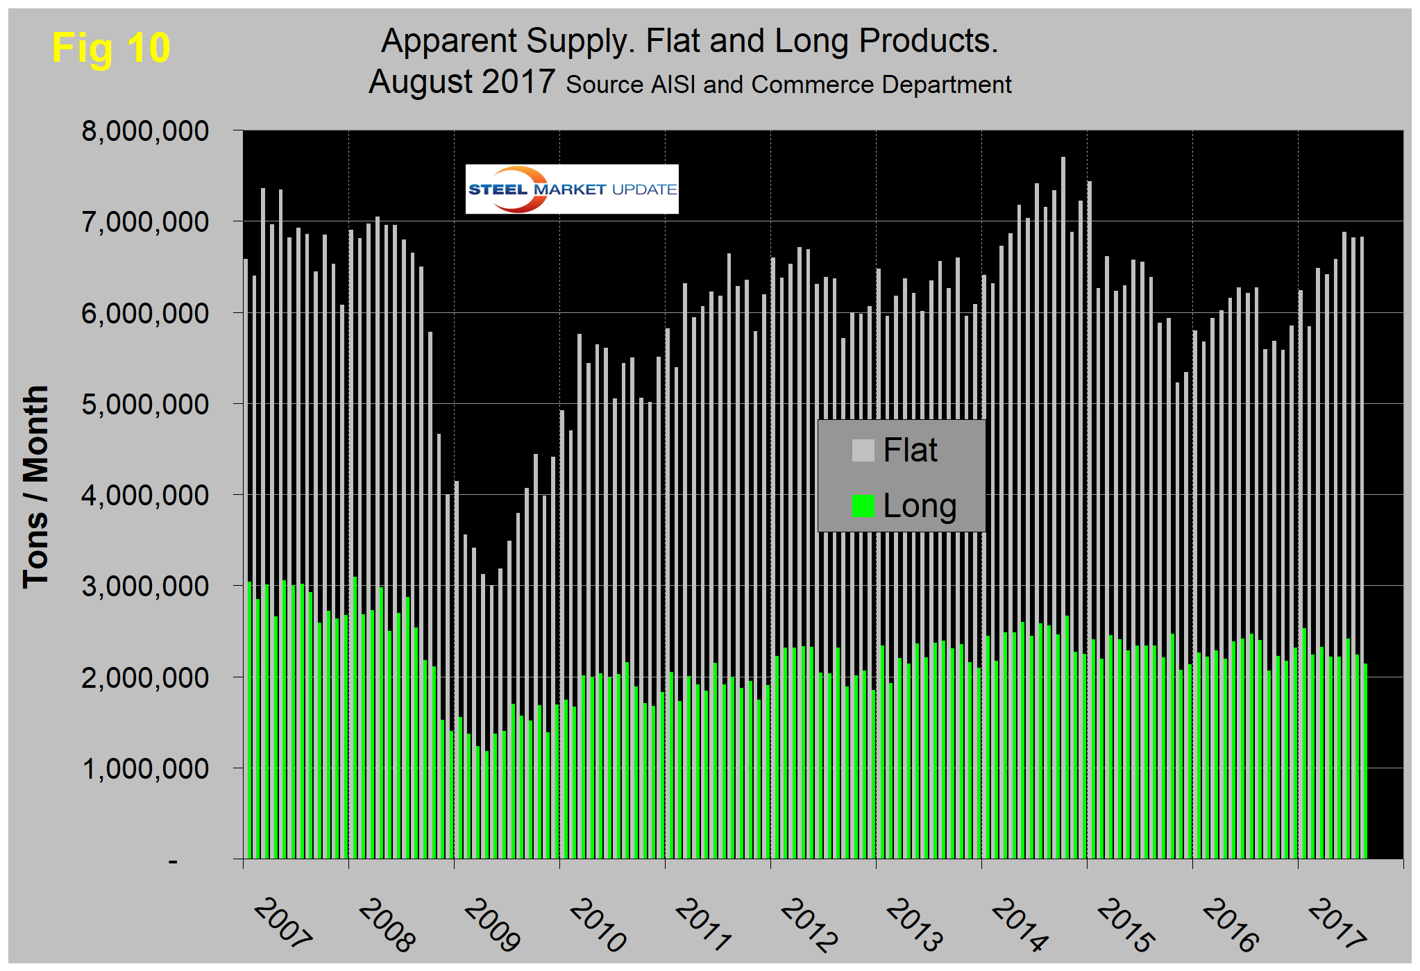
Total supply of long products has gone nowhere since mid-2014 in contrast to the recent double-digit growth at the service center level. Flat rolled products, on the other hand, have had very strong growth in total supply to the market for the last 12 months. At the service center level, sheet products haven’t done much this year, though plate with its much smaller volume has fared better. There is also a discrepancy between total supply to the market and service center shipments of tubular goods. Total supply is up sharply this year, but service center y/y shipments have declined in every one of the last 30 months.
The SMU data base contains additional product specific charts than can be shown in this brief review. For each product, we have 10-year charts for shipments, intake, inventory tonnage and months on hand. Readers are welcome to request extra charts for a particular product.