Market Data

October 15, 2017
Global Economic Activity is Strengthening
Written by Peter Wright
The International Monetary Fund updates its World Economic Outlook (WEO) in April and October each year. The introduction to the WEO released on Tuesday reads as follows: “The global upswing in economic activity is strengthening, with global growth projected to rise to 3.6 percent in 2017 and 3.7 percent in 2018. Broad-based upward revisions in the euro area, Japan, emerging Asia, emerging Europe and Russia more than offset downward revisions for the United States and the United Kingdom. But the recovery is not complete; while the baseline outlook is strengthening, growth remains weak in many countries and inflation is below target in most advanced economies. Commodity exporters, especially of fuel, are particularly hard hit as their adjustment to a sharp stepdown in foreign earnings continues. And while short-term risks are broadly balanced, medium-term risks are still tilted to the downside. For policymakers, the welcome cyclical pickup in global activity provides an ideal window of opportunity to tackle key challenges—namely to boost potential output while ensuring its benefits are broadly shared, and to build resilience against downside risks.” For the full text, click here.
SMU Data Analysis: Figure 1 shows the growth of global GDP since 1970 with this month’s IMF forecast through 2022. We have highlighted the periods of the early 1970s and the mid-2000s when the commodity bubbles prevalent at those times were driven by unusually high and sustained global growth.
The collapse of the commodity bubble in the last decade coincided with the U.S. banking and housing crisis, setting up the perfect storm. After the rebound in 2010, global growth declined through 2016 and is now forecast to expand slowly through 2022. Prior to the 2001 recession, the U.S. held its own in the economic growth stakes, but between 2001 and 2008 growth in the U.S. averaged 1.84 percent less per year than the growth of the global economy as a whole (Fig 2).
In the years 2011 through 2015, the gap narrowed to 0.76 percent. The difference is forecast to widen to 2.08 percent as global growth climbs back to 3.76 percent in 2022. The U.S. has outperformed the Eurozone since 2010 and is forecast to continue to do so through 2022 (Fig 3), though the gap is expected to close.
Figure 4 shows the growth comparison between emerging and developing economies and the advanced economies. That gap is projected to widen through 2022.
Within NAFTA, Canada is forecast to have the highest rate of growth in 2017 with Mexico taking over the lead in 2019 through 2022. Canada performed relatively badly in 2015, but recovered in 2016 and 2017 (Fig 5).
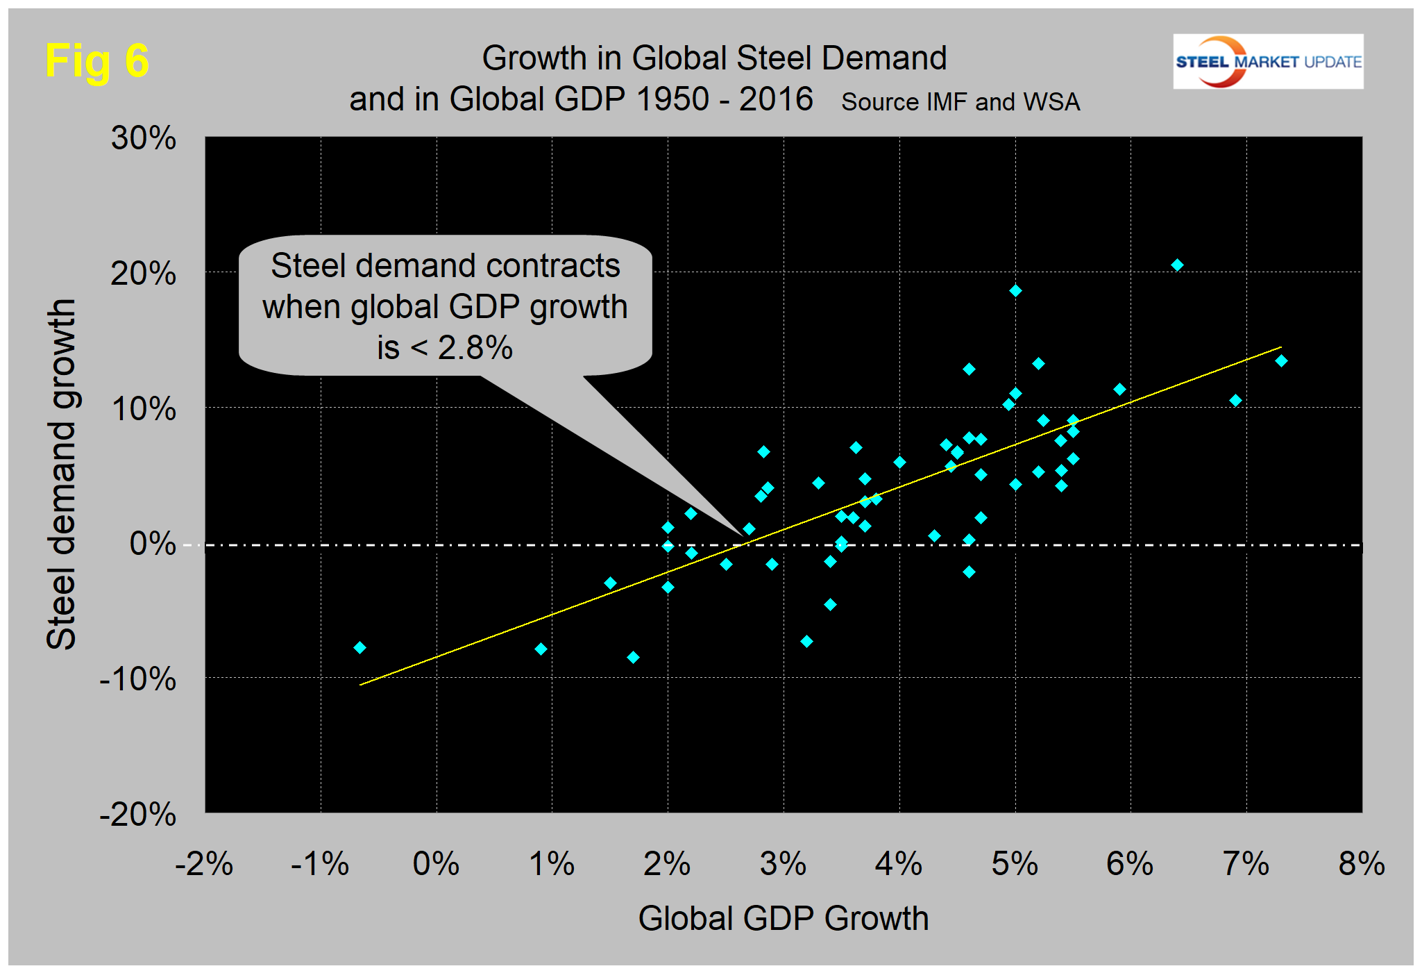
There is a relationship between the growth of GDP and steel demand at both the international and national levels, which also extends to other commodities such as cement. There are two interesting aspects to this relationship. First, the cyclical change in steel demand is vastly more volatile than the change in GDP, which we attribute to the inventory response throughout the supply chain. Second, as discovered by our friends at “Steel Guru,” 1 percent growth in GDP does not result in 1 percent growth in steel demand. At the global level, it takes a 2.8 percent increase in GDP to get any increase in steel demand (Fig 6).
This is a long-term average over a period of 65 years and based on the added volatility of steel can be a predictor of the immediate future. For example, after the disastrous decline in steel demand in 2009, there was no doubt that a huge cyclical rebound would occur as inventory managers throughout the world began to react to the economic recovery. If the IMF forecast proves to be correct, then the growth in global steel demand will improve to around 3 percent annually through 2022. In the U.S. steel market, it requires about 2.2 percent growth in GDP to generate growth in steel demand. Therefore, if current forecasts prove to be correct regarding the U.S. economy, we can expect steel demand to be relatively flat for the next few years.


