

Market Data

September 28, 2017
Energy Prices Up, Rig Counts Down
Written by Peter Wright
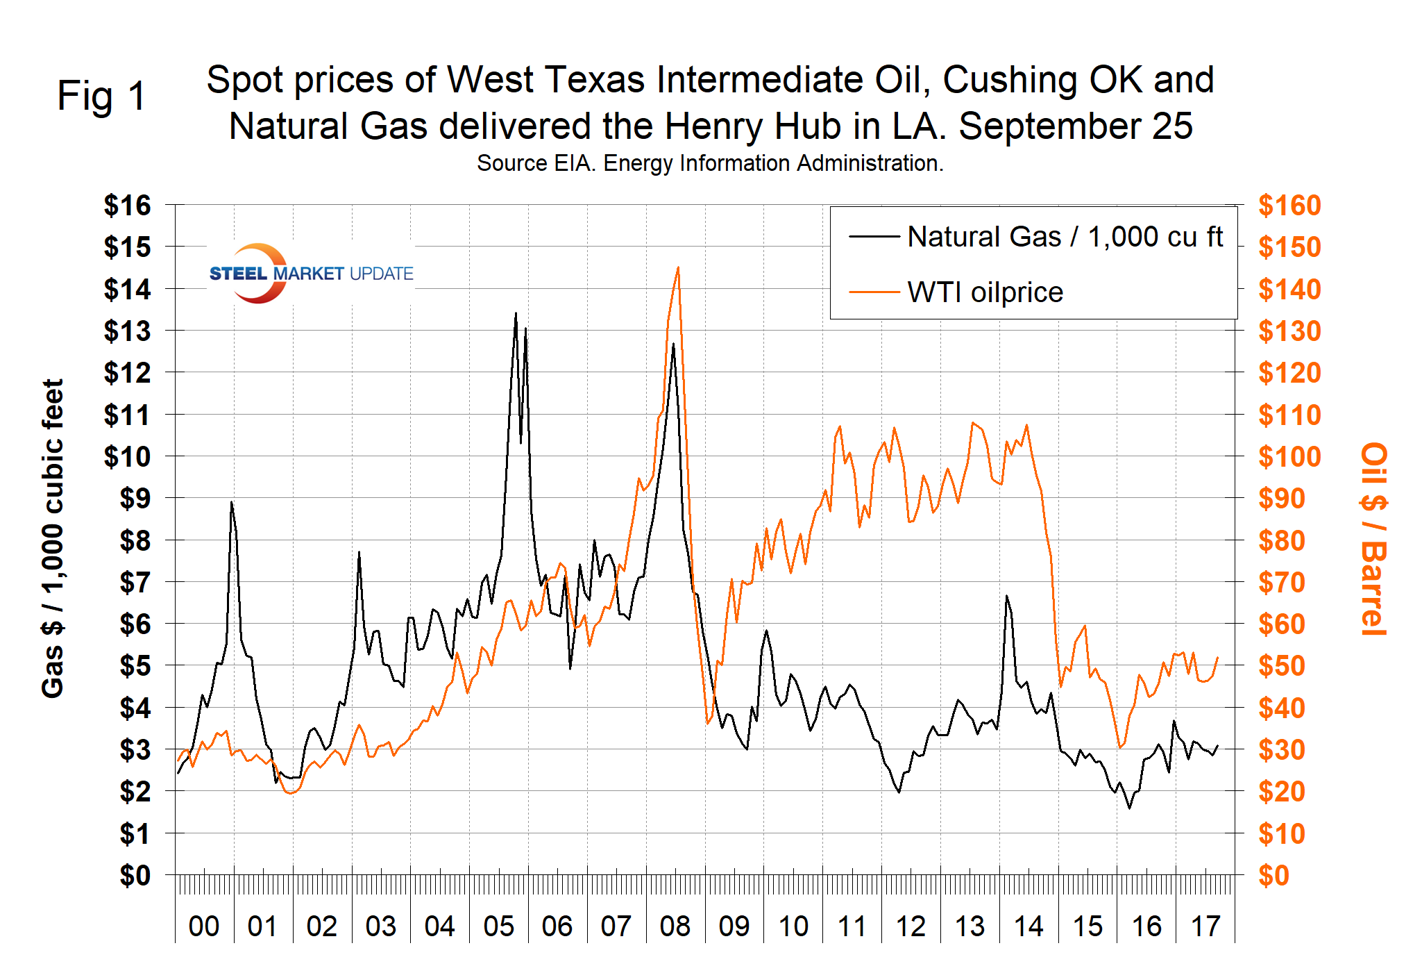
On Wednesday, Sept. 20, the price of West Texas Intermediate (WTI) rose above $50 per barrel for the first time since July 31, which was the only day greater than $50 since May 24. WTI closed at $51.86 on the 25th. The number of operating rigs exploring for both oil and gas had a recent peak of 958 on July 28 and has since declined to 935 on Sept. 22. The prices of oil and natural gas drive the consumption of energy-related steel products including oil country tubular goods, pipe fittings and well head equipment, among others. A significant volume of hot rolled coil is used to make welded tubular goods.
Figure 1 shows historical oil and gas prices since January 2000. The price of WTI has increased for each of the last three months. Our price and inventory data comes from the Energy Information Administration (EIA).
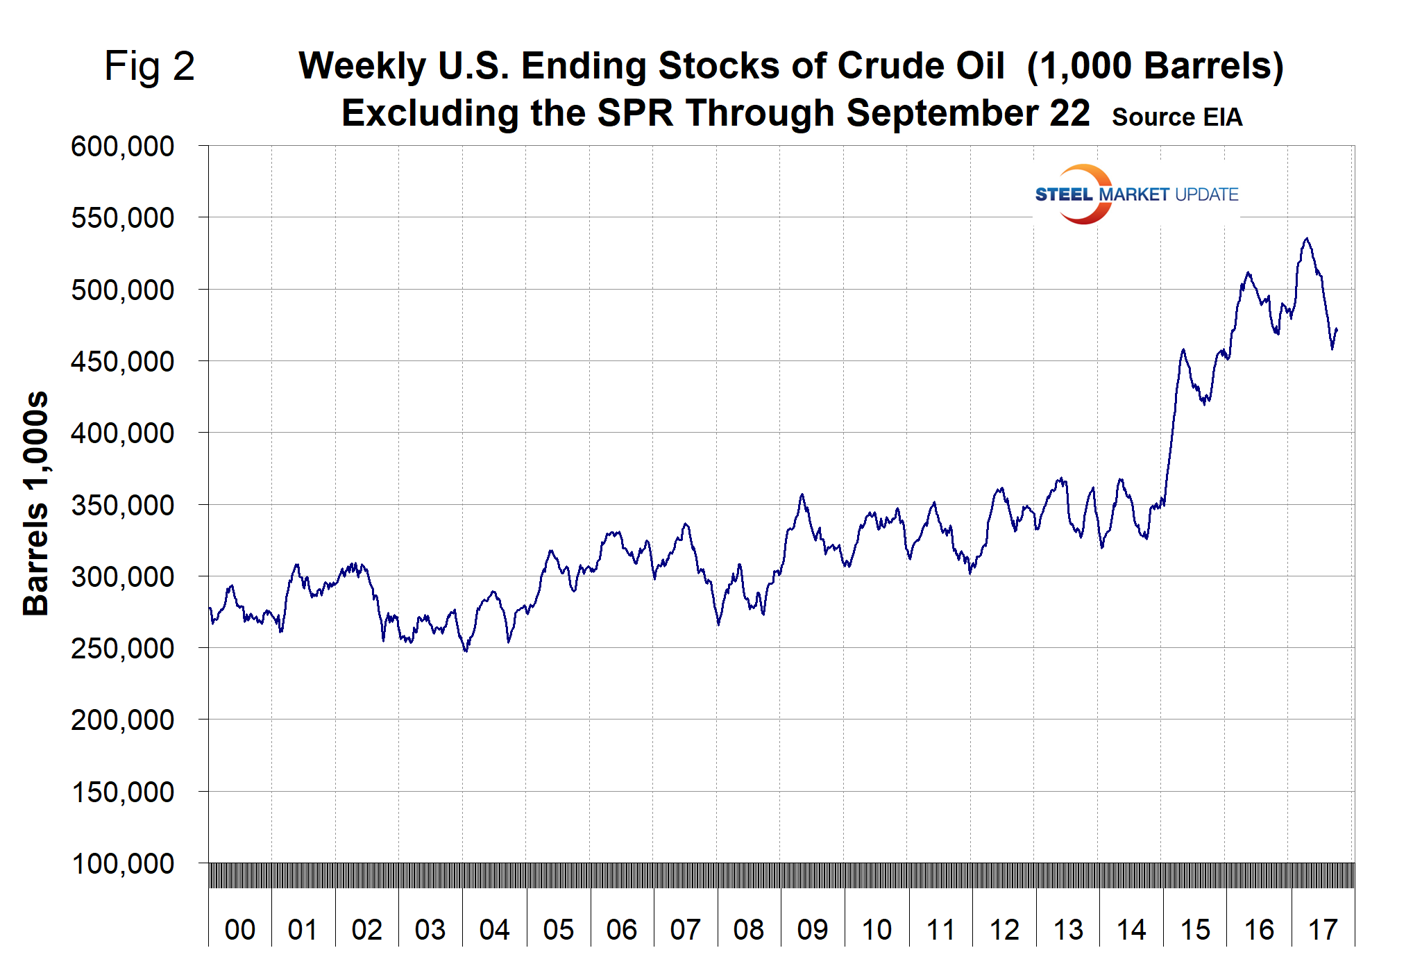
Weekly U.S. stocks of crude oil, excluding the strategic petroleum reserve declined steadily from March 25 to August 25 and then increased by 1 percent through Sept. 22. Stocks on Sept. 22 were almost exactly the same as this time last year, but are still well above the historical norm (Figure 2).
The price of natural gas on Sept. 22 at the Henry Hub in Louisiana was $3.09 per 1,000 cu. ft. This was 24 cents higher than in our August update. “At risk of pointing out the obvious, the last two years have given us a few interesting scenarios we would all be wise to pay attention to,” wrote energy market analyst Scott Anderson on Sept. 23. “When natural gas falls under $2.00, electric providers will eagerly step in and help clear the glut. But by the time it gets back to $3.00, gas and coal pretty much split the 60-65 percent of electric demand that is left after nuclear and the renewables are tapped out. However, as natural gas gets over $3.25 and closer to $4, electric providers don’t hesitate to switch as much load as possible back to coal. And this brings me to my overarching thesis…coal, which unhindered by regulation will act as an anchor to natural gas for at least the remainder of the Trump presidency. Gas will be able to break through $4 periodically if weather cooperates, but will then be quickly brought back down as power producers quickly switch back to coal like we saw last December/January. The flip side of this is that gas has a floor of about $2.00-2.50, the point at which power providers will abandon coal and step in and help clear the gas glut.”
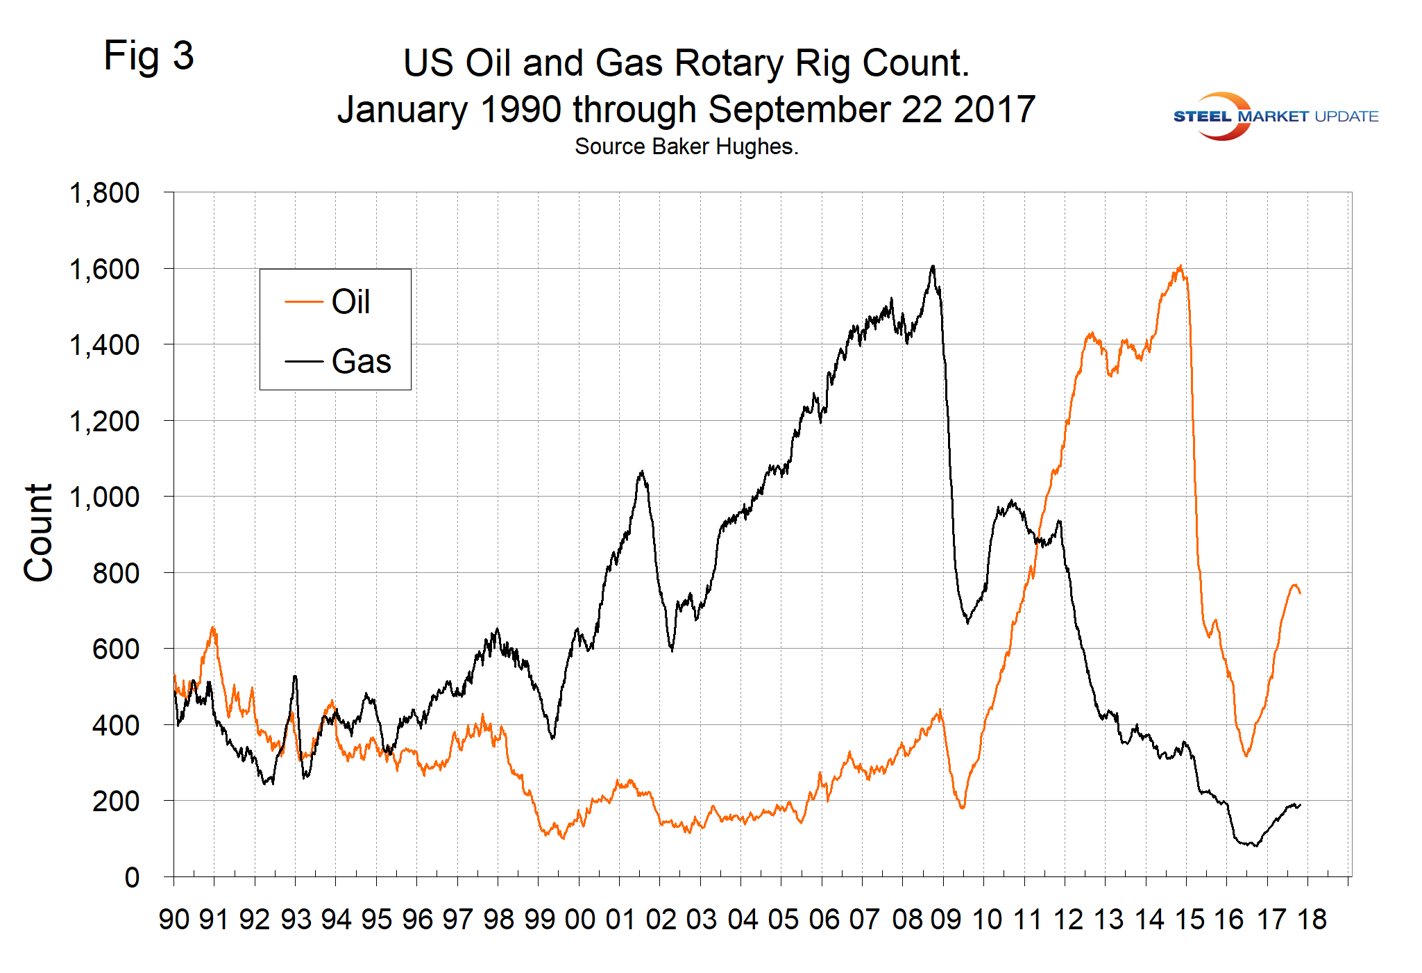
The total number of operating rigs in the U.S. on Sept. 22 was 935, which was a decrease from a recent peak of 958 on July 28. The number of operating rigs has declined for six of the last eight weeks after rising steadily from its low point of 404 on June 27, 2016. The oil rig count had a low point of 316 also on June 27 last year. The U.S. gas rig count rose from its low point of 81 on Aug. 5 last year to 192 on July 28 and was at 190 on Sept. 22. The year-over-year growth rate of U.S. total rigs was 83.0 percent in the latest data. Figure 3 shows the Baker Hughes U.S. Rotary Rig Counts for oil and gas equipment in the U.S. (see explanation below).
On a regional basis in the U.S., the big three states for operating rigs are Texas, Oklahoma and North Dakota. Figure 4 shows the land rig count in those states since 2000 and that non-conventional drilling in North Dakota was down by 73 percent from its heyday in late 2014. This is not as bad as it sounds because previously drilled and capped wells are being put back on stream.
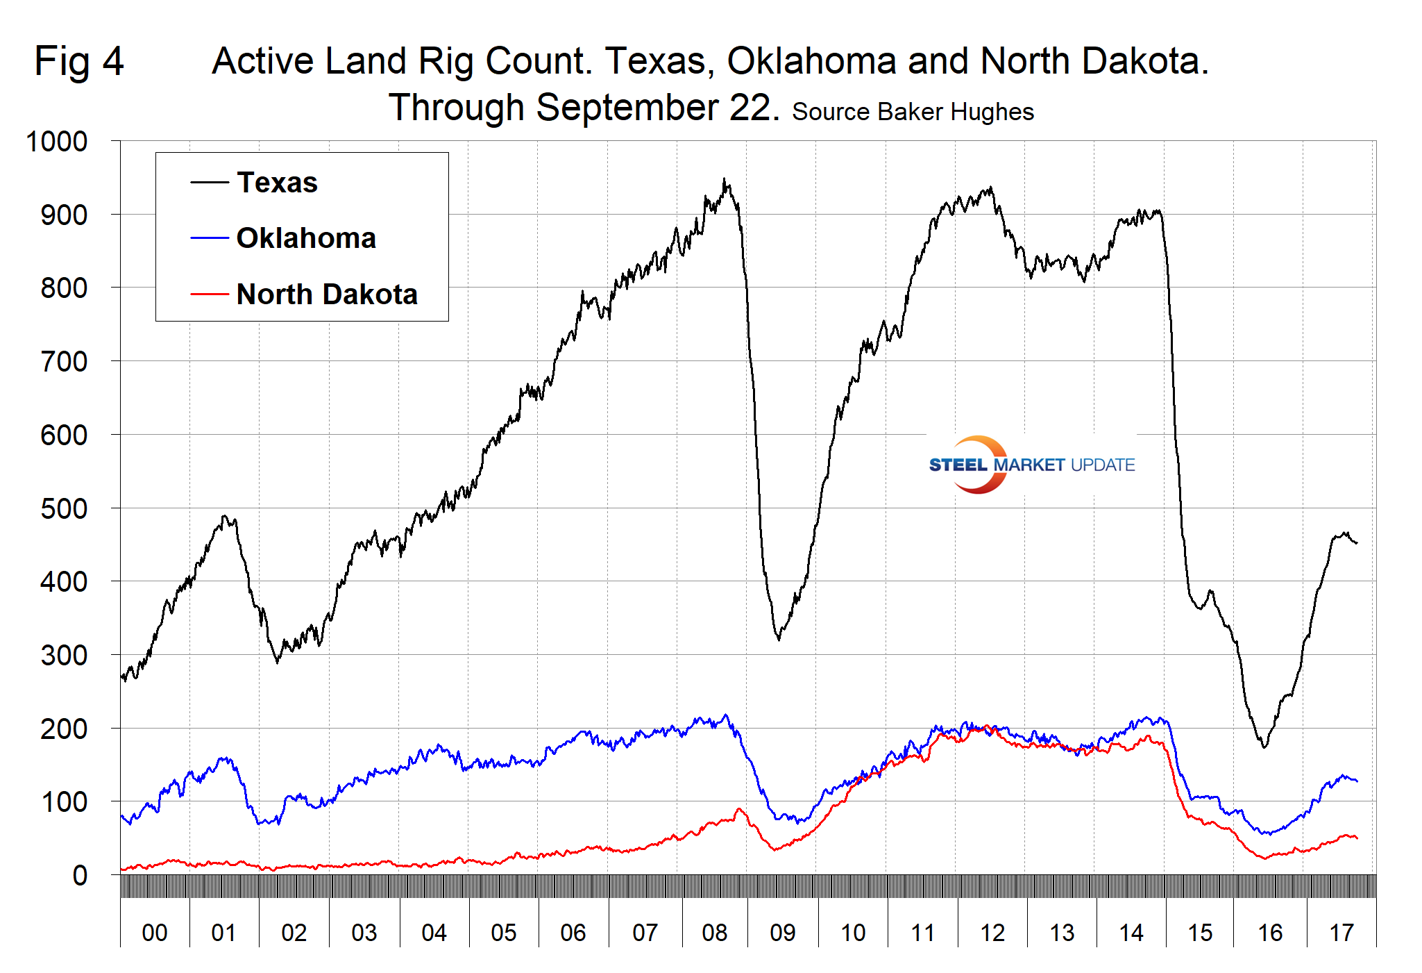
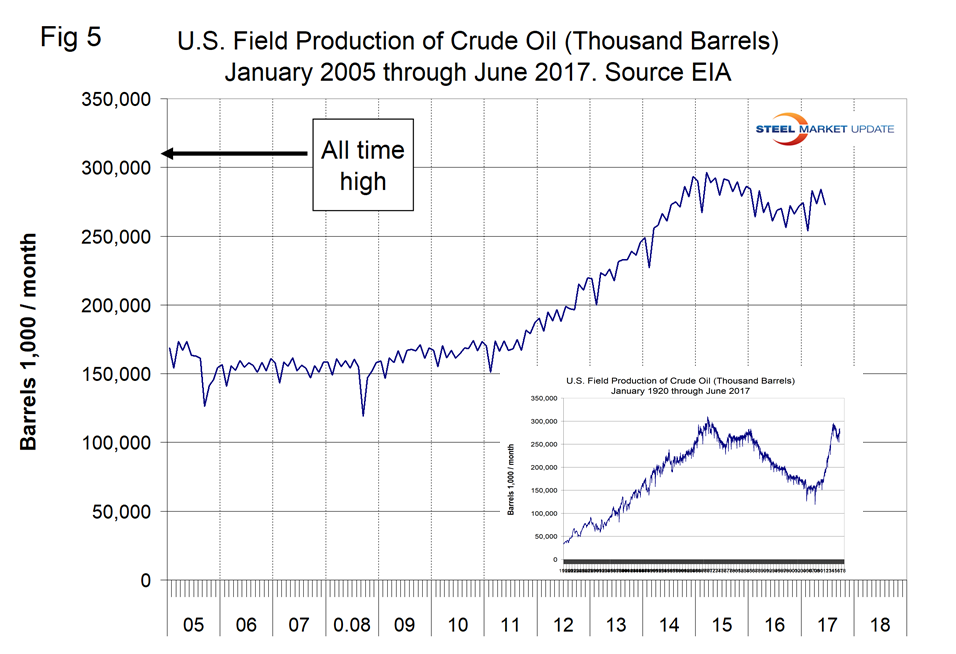
Figure 5 illustrates the U.S. oilfield production of crude oil from January 2005 through June 2017 with an inset back to January 1920. The all-time high for production was 310 million barrels in the month of October 1970. Production in June 2017 was 273 million barrels.
About the Baker Hughes Rotary Rig Count
This is a weekly census of the number of drilling rigs actively exploring for or developing oil or natural gas in the United States. Rigs are considered active from the time they break ground until the time they reach their target depth and may be establishing a new well or sidetracking an existing one. The Baker Hughes Rotary Rig Count includes only those rigs that are significant consumers of oilfield services and supplies.


