Market Data

September 20, 2017
SMU Distributor Apparent Excess/Deficit Inventories Results & Forecast
Written by John Packard
For the second month in a row, Steel Market Update (SMU) did reasonably well with our forecast for August shipments, inventories and where we thought the Apparent Deficit/Excess for service center carbon flat rolled inventories would be at the end of August.
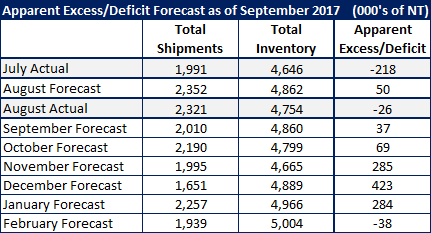
SMU forecast shipments of hot rolled, cold rolled and coated steels would total 2,353,000 net tons for the month of August. Based on the Metals Service Center Institute (MSCI) reporting from earlier this week, actual shipments out of the distributors totaled 2,321,000 net tons. Our forecast for a higher distributor daily shipment was correct. However, the size of the increase was slightly less than what we expected.
At the same time, SMU forecast total flat rolled inventories would be at 4,862,000 net tons, while MSCI reported inventories to be 4,754,000 net tons. This is one area that we got the direction wrong. We forecast daily receipts would rise from 108,465 tons per day in July to 111,623 tons per day in August. Receipts actually fell to 105,625 tons per day.
Based on our proprietary model, SMU forecast service centers would be carrying 50,000 tons of excess inventories at the end of the month. At +50,000, we would consider the service center inventories to be balanced. The actual total of excess/deficit in flat rolled inventories was a deficit of 26,000 tons, which we also consider to be an essentially balanced position for the U.S. flat rolled distributors.
September Forecast
Using the same proprietary formula as July and August, SMU is now forecasting total shipments for September to be 2,010,000 tons. This is down slightly from August, but there are three fewer shipping days in September (20) versus the 23 shipping days in August.
We believe total inventories at the end of September will be 4,860,000 tons, or just under 100,000 tons higher than what was reported at the end of August by MSCI.
Our forecast also calls for the flat rolled distributor inventories to remain essentially balanced, going from a small deficit of -26,000 tons at the end of August to a small excess totaling +37,000 tons.
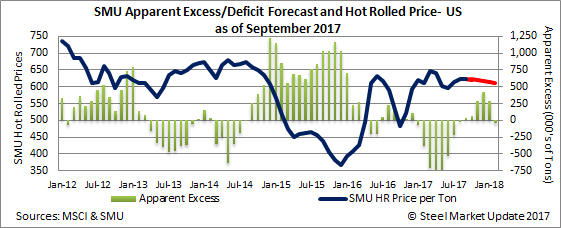
Looking out a little further, our forecast calls for the Apparent Inventory Excess to increase through the end of the year before pulling back in early 2018.
If we are correct and the Apparent Excess were to grow, this would begin to put pressure on prices as we head into fourth-quarter 2017.
Here is what that looks like:


We remind everyone that our model assumes the MSCI data to be reasonably correct. We have started working with a number of service centers in order to produce our own inventories index, which we then can compare to whatever other data is available. In the early life of our index, we are not projecting total steel inventories and shipments as MSCI does with their data.


