Market Data

August 3, 2017
Buyers, Sellers of Steel Remain Optimistic
Written by Tim Triplett
The SMU Steel Buyers Sentiment Index continues to represent buyers and sellers of flat rolled steel as being optimistic about their companies’ ability to be successful in both the current market environment as well as three to six months into the future.
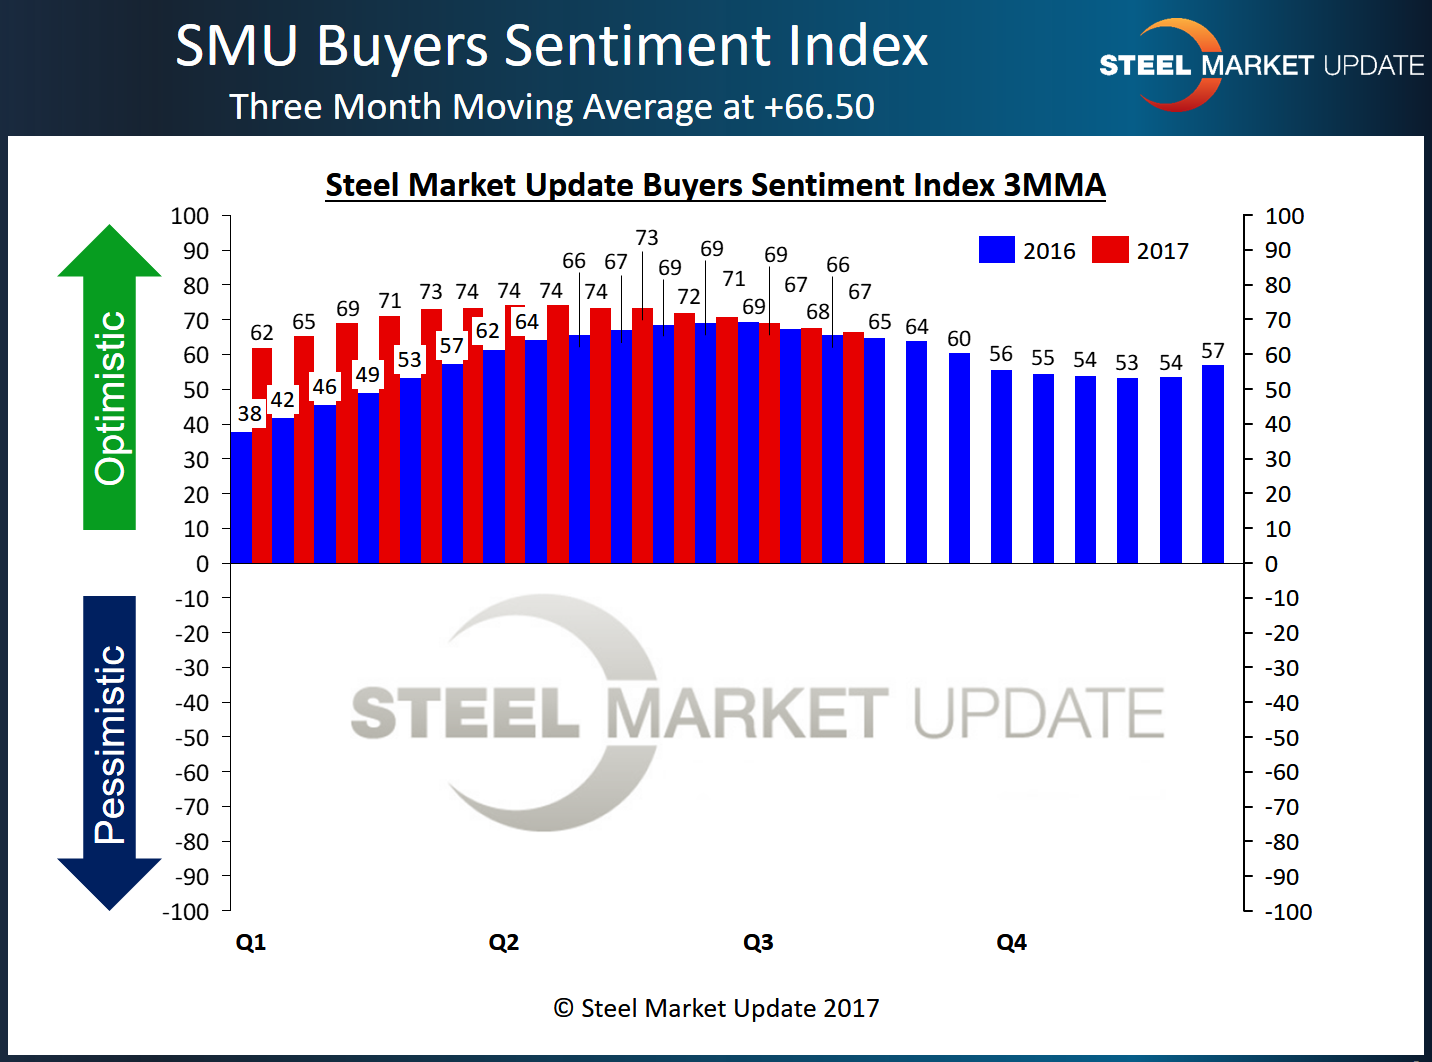
As a single data point collected by Steel Market Update as part of our flat rolled steel market trends analysis over the course of this week, the “Current” SMU Steel Buyers Sentiment Index has inched up in over the past four weeks indicating that steel buyers are slightly more optimistic about the existing market conditions’ impact on their ability to be successful.
However, when we measure Sentiment as a three-month moving average, it indicates the slide in optimism that we have been seeing since the peak recorded in early March (+74.17) continues. In SMU’s opinion, we believe the combination of a slowdown in demand in Q2 followed by the uncertain regulatory environment associated with Section 232 may be keeping optimism in check.
Looking at the Numbers
As a single data point, Current Sentiment is at +67, up 4 points from the last survey taken two weeks ago. One month ago, sentiment was +65; a year ago it was +58.
Steel Market Update’s preference is to look at the data based on a three-month moving average (3MMA). This smooths out the index and provides a better look at the true trend. The Current Sentiment 3MMA is at +66.50, down slightly from +67.50 two weeks ago and +69.00 one month ago. One year ago, the 3MMA was +65.67. The 3MMA continues the slight downtrend it has seen since peaking at +74.17 in the first week of April.
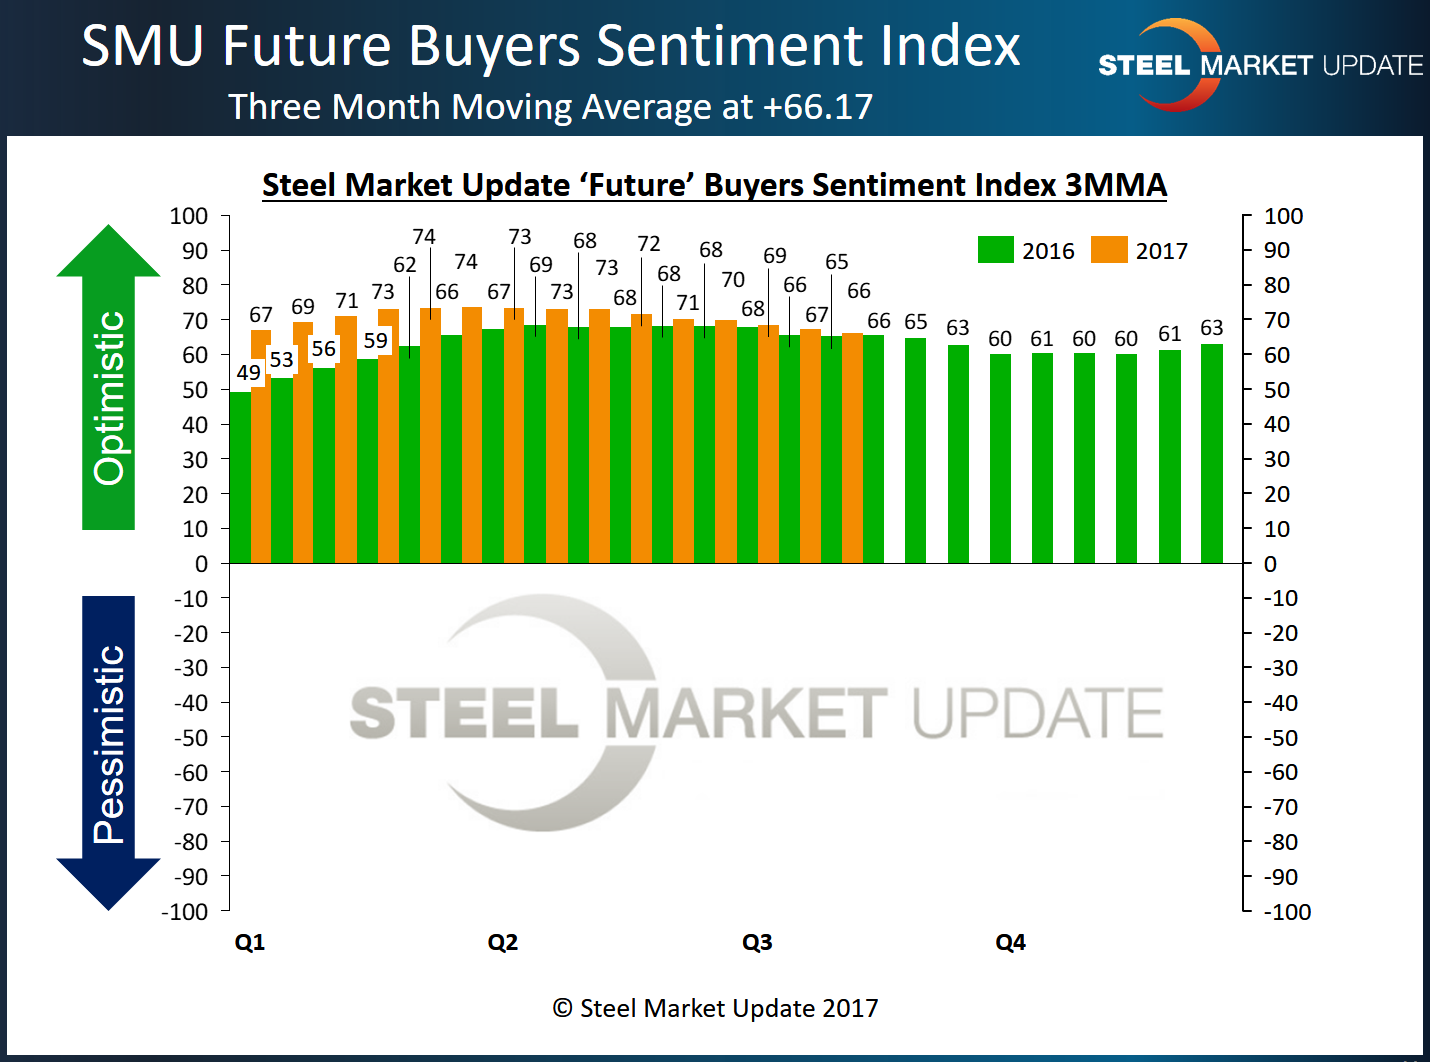
Future Sentiment, which is how flat roll buyers and sellers see their company’s chances for success three to six months into the future, registered +68, up 3 points from the mid-July survey. One month ago, Future Sentiment was at +64, the same level as this time last year.
Much like what we are recording with Current Sentiment, when looking at Future Sentiment as a three-month moving average the index registered +66.17, down from +67.33 two weeks ago. One month ago, the Future Sentiment 3MMA was at +68.50; it measured +65.17 a year ago. The Future 3MMA peaked in mid-March 2017 at +73.67.
What Respondents are Saying
Comments from respondents suggest that the delayed decision on Section 232 trade action is still affecting the market. “The uncertainty of 232 is a problem,” said one trader. “While everyone was hoping for some clarity or settlement on the Section 232 investigation, it now seems less likely to be implemented as quickly and as drastically as was expected. We see this as a signal to proceed cautiously,” said another.
As one service center executive noted: “It’s strange. For weeks, we’ve been saying that lack of visibility on Section 232 is making it difficult to plan. Now we know it’s being delayed, but the forward visibility hasn’t improved.” Concluded another wholesaler, “Government meddling in a commodity market is never a good thing!”
About the SMU Steel Buyers Sentiment Index
SMU Steel Buyers Sentiment Index is a measurement of the current attitude of buyers and sellers of flat rolled steel products in North America regarding how they feel about their company’s opportunity for success in today’s market. It is a proprietary product developed by Steel Market Update for the North American steel industry.
Positive readings will run from +10 to +100 and the arrow will point to the right-hand side of the meter located on the Home Page of our website indicating a positive or optimistic sentiment. Negative readings will run from -10 to -100 and the arrow will point to the left-hand side of the meter on our website indicating negative or pessimistic sentiment. A reading of “0” (+/- 10) indicates a neutral sentiment (or slightly optimistic or pessimistic), which is most likely an indicator of a shift occurring in the marketplace.
Readings are developed through Steel Market Update market surveys that are conducted twice per month. We display the index reading on a meter on the Home Page of our website for all to see. Currently, we send invitations to participate in our survey to almost 600 North American companies. Our normal response rate is approximately 110-150 companies. Of those responding to this week’s survey, 38 percent were manufacturers and 46 percent were service centers/distributors. The balance was made up of steel mills, trading companies and toll processors involved in the steel business. Click here to view an interactive graphic of the SMU Steel Buyers Sentiment Index or the SMU Future Steel Buyers Sentiment Index.


