Market Data

July 2, 2017
June at a Glance
Written by John Packard
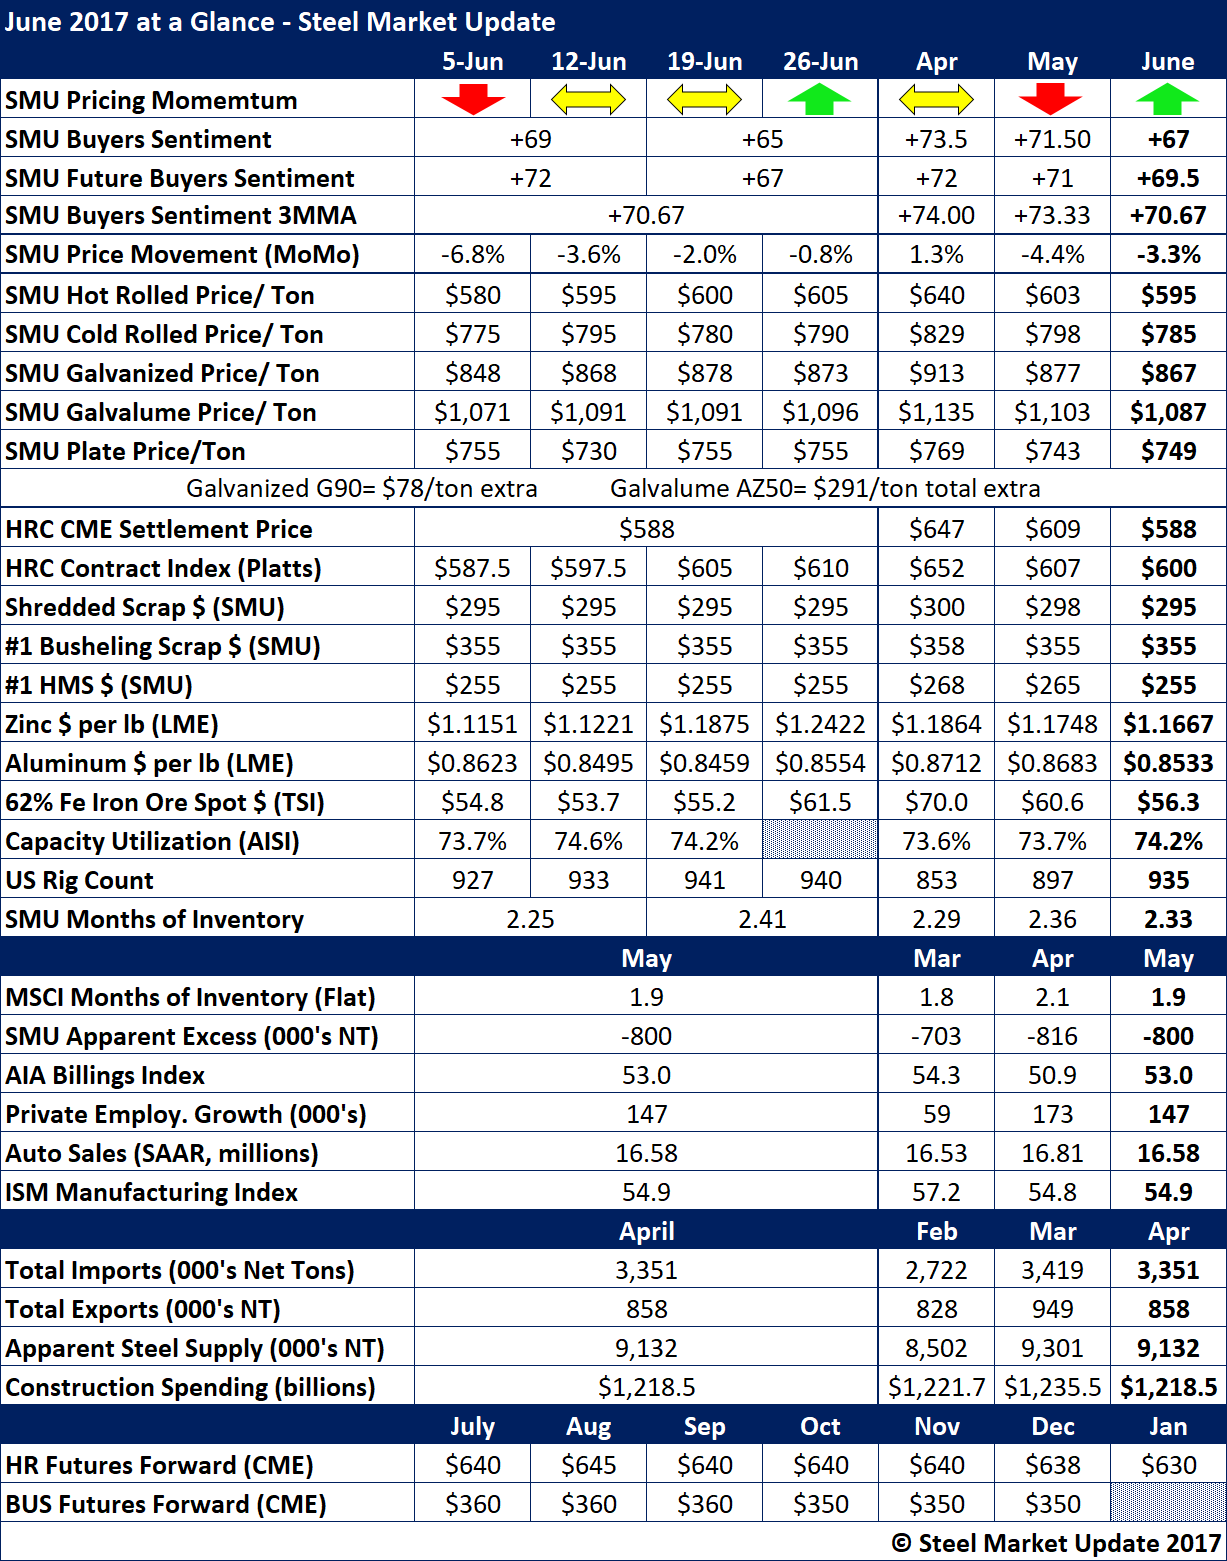
We ended the month of June with a change in our Price Momentum Indicator from Neutral (we had moved from lower to Neutral earlier in the month) to Higher. With the expectation of Section 232 being implemented by President Trump, we feel prices have only one way to go, up. How long that will last is going to be the question as we move into July.
One of the reasons we have some concerns is due to our Steel Buyers Sentiment Index, which has been sliding over the past three months, as seen in the data shown in our table for June below. Both as single data points and our three-month moving average, Sentiment has been dropping, albeit from record high levels. This will need to be watched in July.
As a monthly average, hot rolled prices have dropped over the past three months. However, we started to see a reverse in pricing beginning the 19th of June and continuing through the end of the month. With an extra “push” from the government, the question is how high can prices go? Our benchmark HRC average for the month of June was $595 per ton vs. CME settlement of $588 per ton and Platts average of $600 per ton.
Zinc is another commodity where the monthly average does not tell the story. Zinc prices went from $1.11 per pound to $1.24 per pound from the beginning to the end of the month. Aluminum, on the other hand, went nowhere over the course of the month.
MSCI inventories on carbon flat rolled continued to be reported at less than 2.0 months. Our own survey has flat rolled as steady at 2.33 months supply. Using the MSCI data, our Apparent Deficit for service center inventories was -800,000 tons. We have questions as to whether the numbers being used as the basis for our Apparent Excess/Deficit model are accurate.