Market Data

July 1, 2017
Chicago Business Barometer Jumps in June
Written by Sandy Williams
The Chicago Business Barometer took a giant leap in June, expanding from 59.4 in May to 65.7. The Barometer, which is designed to predict future changes in gross domestic product, was at its highest level since 2014. The average score for second quarter was 61.1, significantly stronger than the average of 55.1 in Q1.
The new orders score accelerated 10.5 points to 71.9 for its highest reading since May 2014. Production, backlogs and supplier delivery times all grew significantly in June. Order backlogs averaged a score of 52.5 for second quarter after contracting for the past nine quarters.
Inventories decreased as manufacturers worked to meet increased demand. Inventories were at their lowest level of the year, down 3.6 points to 51.9. Factory gate prices were stable after declining for three consecutive months. Prices for steel and plastic products rose, but survey respondents noted that suppliers were not passing through price increases.
Employment levels were down slightly to 56.6 from 57.1 in May. Concern was expressed about availability of reliable and qualified workers.
Manufacturers were more optimistic about future orders in Q3 as compared to Q2. Confidence in new business appeared stronger than last year at this time.
“June’s MNI Chicago Business Barometer Survey is a testament to firms’ expectations of a busy summer. With Production and New Orders touching levels not seen in three years, rising pressure on backlogs and delivery times has led to higher optimism among firms both in general business conditions and the local economy,” said Shaily Mittal, senior economist at MNI Indicators.
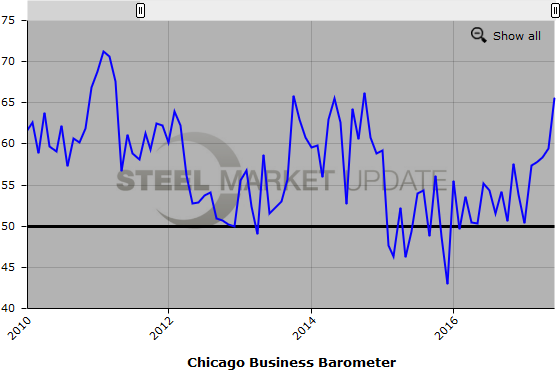
The Chicago Business Barometer, published monthly by MNI Indicators and also referred to as the Chicago PMI, is a composite diffusion indicator made up of the Production, New Orders, Order Backlogs, Employment and Supplier Deliveries indicators and is designed to predict future changes in U.S. gross domestic product (GDP). An indicator reading above 50 indicates expansion compared with a month earlier, while below 50 indicates contraction. A result of 50 is neutral. The further an indicator is above or below 50, the greater or smaller the rate of change.
Below is a graph showing the history of the Chicago Business Barometer. You will need to view the graph on our website to use its interactive features, you can do so by clicking here. If you need assistance logging into or navigating the website, please contact our office at 800-432-3475 or info@SteelMarketUpdate.com.