Market Data

May 23, 2017
SMU Service Center Apparent Deficit Expected to Peak in May
Written by John Packard
A number of the Steel Market Update prognostications for service center inventories and shipments came true (well, almost).
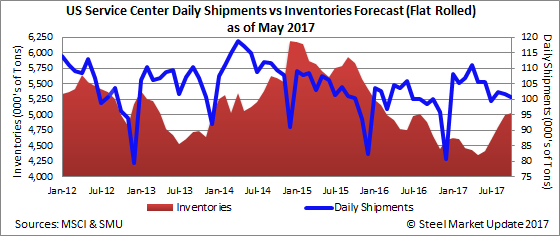
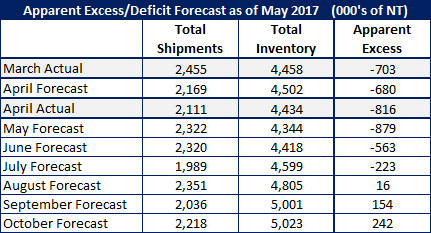
We forecast daily shipments would rise on a tons per day basis to 108,400 tons per day. In actuality they rose to 111,100 tons per day. Since April 2017 only had 19 shipping days (according to MSCI) our forecast for total monthly shipments 2,169,000 tons was close to the actual MSCI number of 2,111,000 tons. We correctly forecast shipments to drop from the 2,455,000 tons reported by the MSCI at the end of March.
![]() March flat rolled inventories ended the month at 4,458,100 tons. We forecast inventories to increase by 44,000 tons and instead they declined by 24,000 tons.
March flat rolled inventories ended the month at 4,458,100 tons. We forecast inventories to increase by 44,000 tons and instead they declined by 24,000 tons.
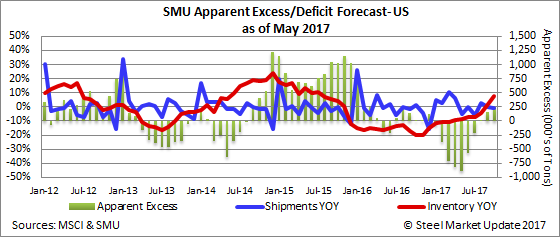
At the end of March the SMU Service Center Inventories Apparent Deficit was -703,000 tons and we believed the deficit would drop to -680,000 tons at the end of April. Based on the MSCI data and our proprietary model the deficit actually grew to -816,000 tons.
May 2017 Forecast
Based on our model using the previous three year moving average for the month of May we anticipate shipments will come in at 105,565 tons per day. This is a conservative number as the 3-year moving average for May is 109,500 tons per day and April came in at 111,100 tons per day (the highest level since September 2014). One year ago, May shipments totaled 103,800 tons per day. Total shipments of flat rolled are expected to be 2,322,000 tons during the month of May.
Inventories are expected to be 4,344,000 tons at the end of May which would be 100,000 tons lower than what was reported by the MSCI at the end of April.
Apparent Excess/Deficit Forecast?
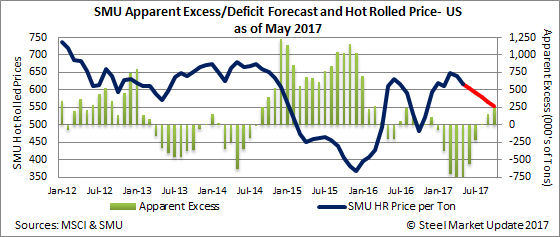
Based on the above forecast Steel Market Update (SMU) anticipates a continuation of the Apparent Deficit in flat rolled inventories totaling -879,000 tons. This is slightly higher than the -816,000 tons based on our model for the end of April.
Our model, which calls for shipments to revert closer to the 3-year average, will see the deficits drop and by August we should see inventories back to a balanced situation.
All of this is predicated on the MSCI data being correct and not over-stating or under-stating inventories.


