Prices

April 24, 2017
Global Steel Production in March and Forecast through 2017
Written by Peter Wright
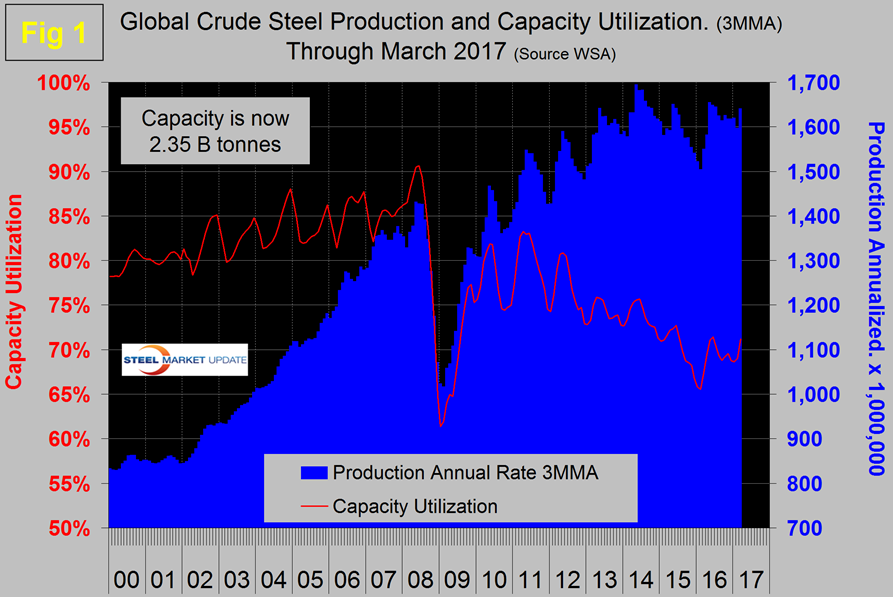
Production in the month of March was 144,953,000 metric tons, up from 127,227,000 tons in February. Capacity utilization at 74.0 percent was up from 70.3 in February. The three month moving averages (3MMA) that we prefer to use were 136,737,000 and 71.2 percent respectively. Production in February was severely influenced by the short month. Capacity is 2.35 billion tonnes per year. Figure 1 shows monthly production and capacity utilization since March 2000.
On a tons per day basis, production in March was 4.676 million tonnes with a 3MMA of 4.557 which was the highest t/d result since July 2014. The growth of daily production month on month was 2.91 percent which was up from 2.05 percent in February. Since 2011, capacity utilization has been on an erratically downward trajectory. On October 9th the OECD’s steel committee reported that global capacity is expected to increase by almost 58 million tonnes/year between 2016 and 2018 bringing the total to 2.43 billion tonnes.
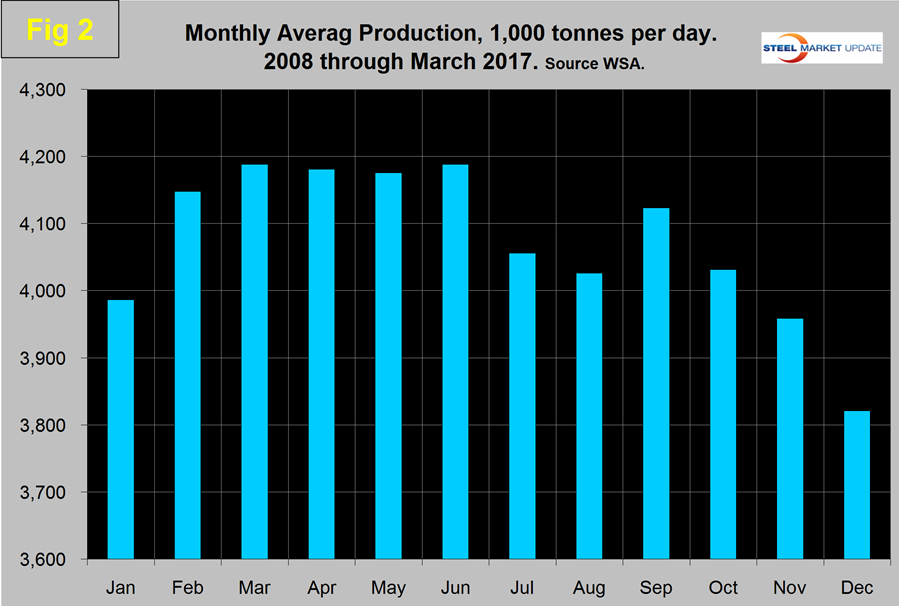
As we dig deeper into what is going on we start with seasonality. Global production has peaked in the summer for the last seven years. Figure 2 shows the average tons/day production for each month since 2008.
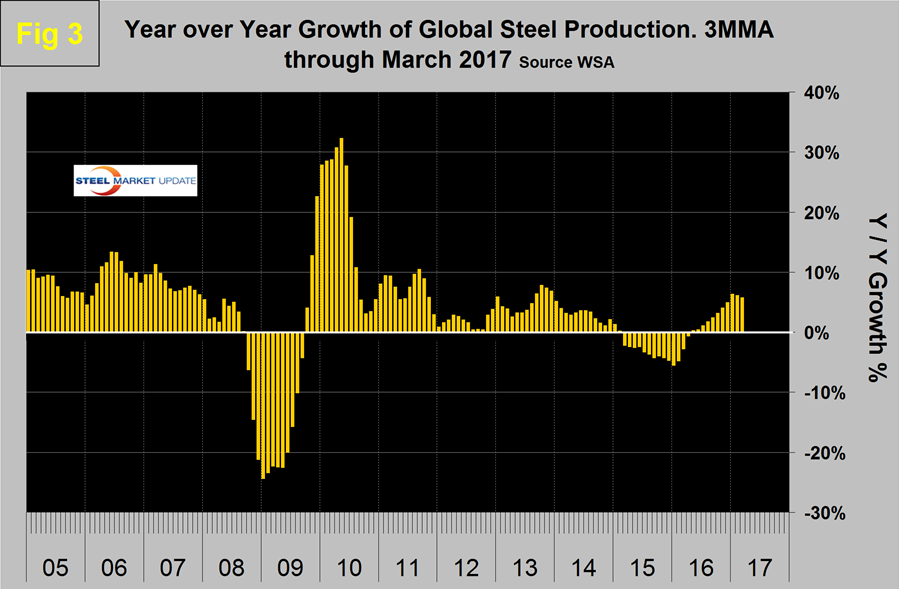
In those ten years on average, March has increased by 0.98 percent, this year March increased by 2.91 percent. Figure 3 shows the monthly year over year growth rate on a 3MMA basis since March 2005.
Production began to contract in March 2015 and the contraction accelerated through March 2016 when it reached negative 5.5 percent. In the next four months contraction slowed and in May 2016 growth became positive. In the first quarter of 2017, growth has averaged 6.1 percent. For the last four months China’s growth rate has been lower than the rest of the world. A welcome sign which if it becomes a long term trend will take some pressure off the global market.
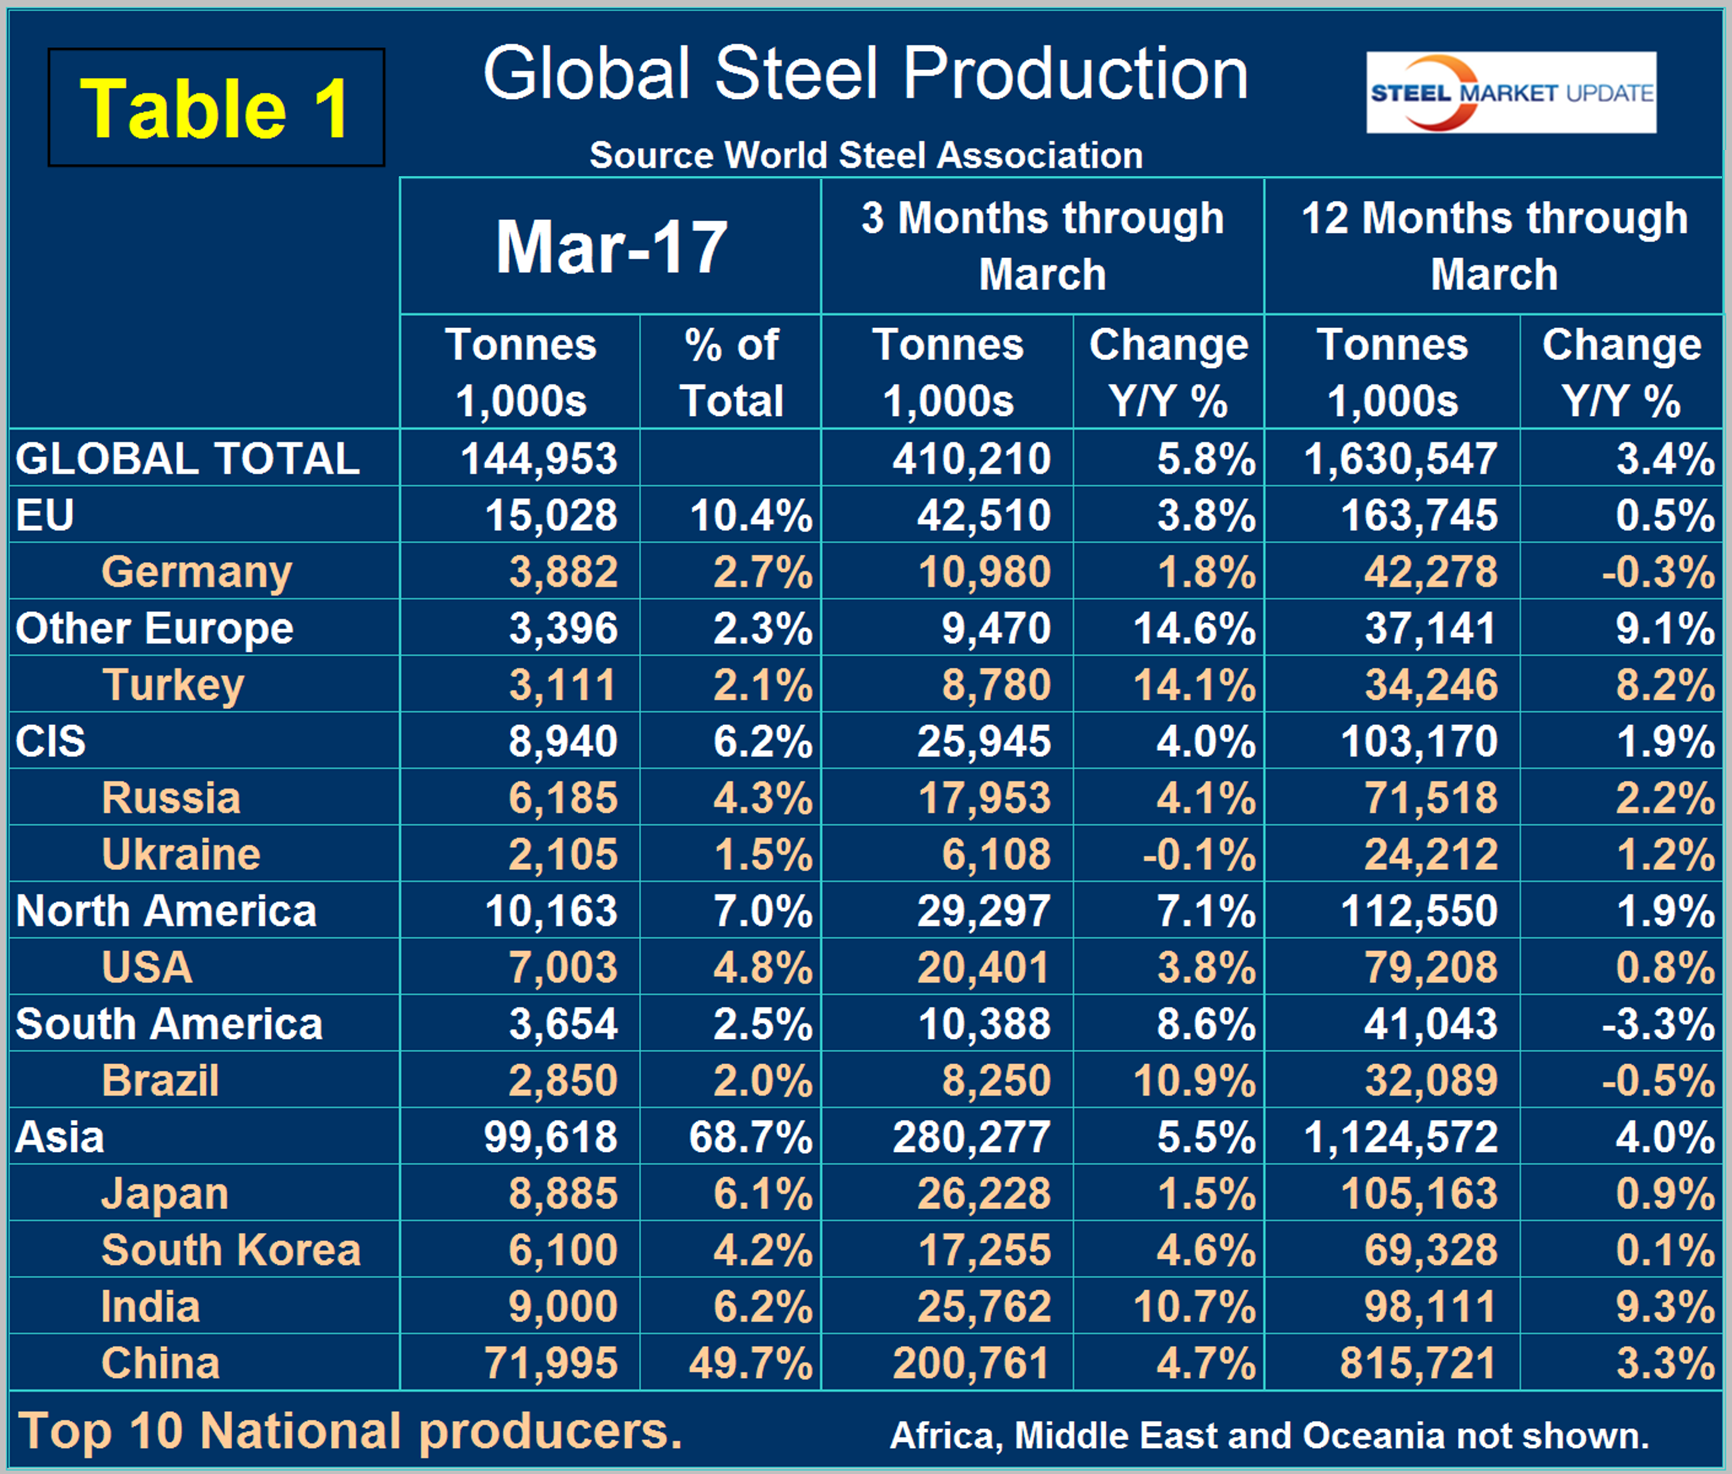
Table 1 shows global production broken down into regions and also the production of the top ten nations in the single month of March and their share of the global total. It also shows the latest three months and twelve months production through March with year over year growth rates for each period. Regions are shown in white font and individual nations in beige.
The world as a whole had positive growth of 5.8 percent in 3 months and 3.4 percent in 12 months through March. If the three month growth rate exceeds the twelve month we interpret this to be a sign of positive momentum which has been the case for the last fourteen months. In March China’s share of global production was 49.7 percent.
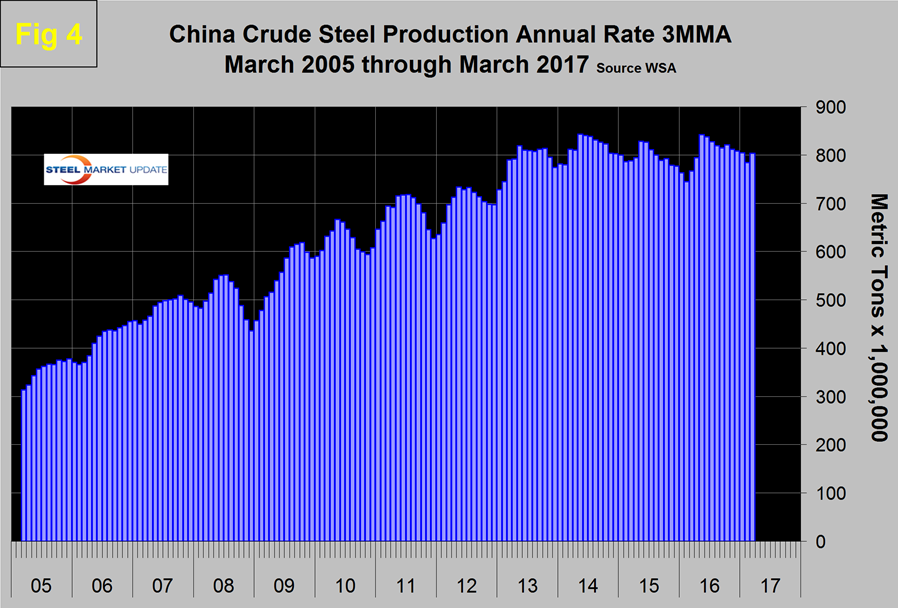
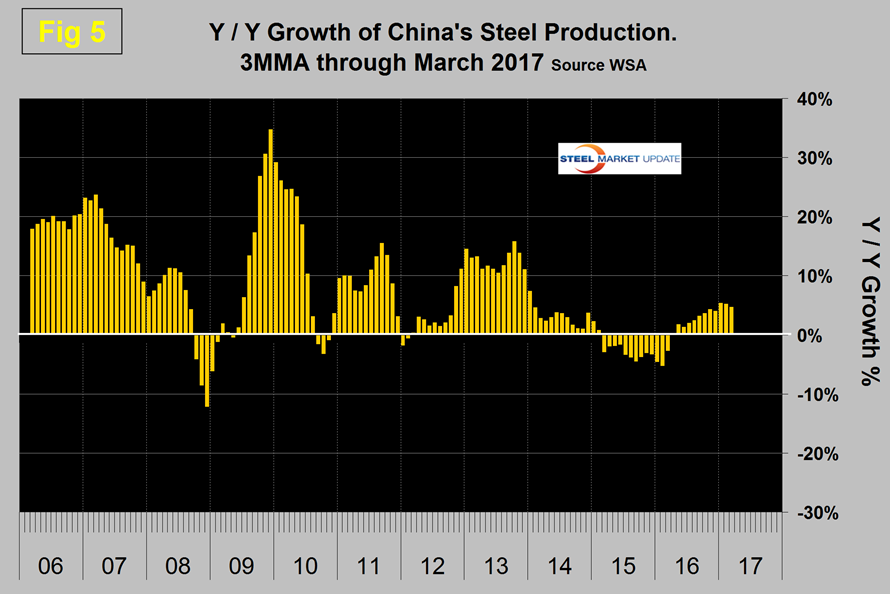
Figure 4 shows China’s production since 2005 and Figure 5 shows the y/y growth.
China’s production after slowing for 13 straight months year over year returned to positive growth each month in May through March on a 3MMA basis. It may look from Figure 4 as though China’s production is falling but on a y/y basis this is not the case. Therefore the slowdown in Chinese steel production that they have been promising is not happening.
In 3 months through March y/y every region and all of the top 10 producing nations had positive growth. Asia as a whole was up by 5.5 percent with India up by 10.7 percent. Other Europe (mainly Turkey), was up by 14.1 percent and North America was up by 7.1 percent. Within North America the US was up by 3.8 percent, Canada was up by 7.1 percent and Mexico up by 24.1 percent. In Q1 2017, Mexico produced 25 percent more steel than Canada.
The October 2016 version of the World Steel Association Short Range Outlook (SRO) for apparent steel consumption in 2016 and 2017 forecast a global growth of 0.2 percent in 2016 and 0.5 percent in 2017. Note this forecast is steel consumption, not crude steel production which is the main thrust of what you are reading now. As it turned out global production in 2016 beat this forecast which suggests that the surge in the last six months was unexpected. The next short range outlook will be published later this month.
SMU Comment: A reduction in capacity do not necessarily result in a reduction in production. China’s efforts to reduce both capacity and pollution are not translating into lower production. In addition new plants are coming on stream world wide, the net result of closures and startups according to the OECD will be an additional 58 million tons of capacity by the end of 2018. A welcome report from the IMF in its April update of the World Economic Outlook raised the projected global growth rate for 2017 and 2018. Growth in the developing world is highly steel intensive therefore this will take some pressure off the low global rate of capacity utilization.
Source: World Steel Association with analysis by SMU.


