Market Data

March 1, 2017
China’s Economic Statistics and Steel Production through Q4 2016
Written by Peter Wright
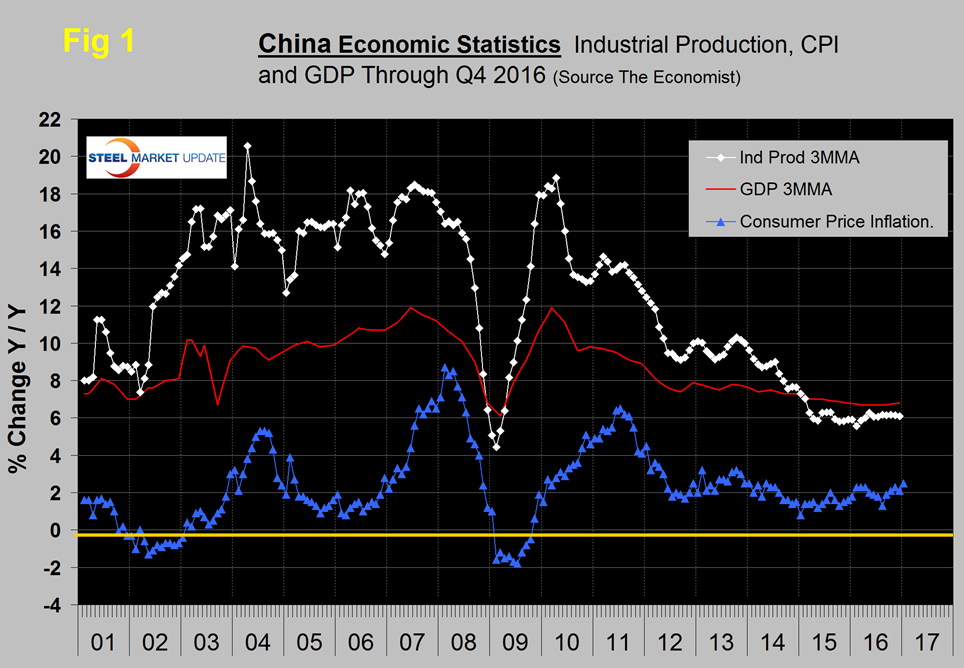
Once each quarter we publish the official statistics for Chinese GDP, industrial production, consumer price inflation and fixed asset investment. Currently available GDP data is through the fourth quarter, other data included here is through December or January. Many analysts don’t believe these Party self-serving figures but we include them in our reports because of the importance of China in the global steel scene and these numbers are all there is. Figure 1 shows published data for the growth of GDP, industrial production and consumer prices through the fourth quarter of 2016.
The GDP and industrial production portions of this graph are three month moving averages. The growth of GDP was 6.8 percent in Q4 which was the same as in Q4 2015. The reported growth rate of GDP has declined steadily since it peaked at 11.9 percent in Q1 2010. Consumer price inflation averaged 1.44 percent in 2015 and in 2016 averaged 2.00 percent. Industrial production has been little changed since March 2015.
Earlier this month Economy.com wrote: China’s fourth quarter GDP confirmed that the economy is in the midst of a cyclical upswing. The economy is working through the effects of overcapacity in heavy industries. The government notes that the steel and coal sectors, “successfully fulfilled the task of cutting overcapacity in 2016.” (SMU comment, unbelievable!)
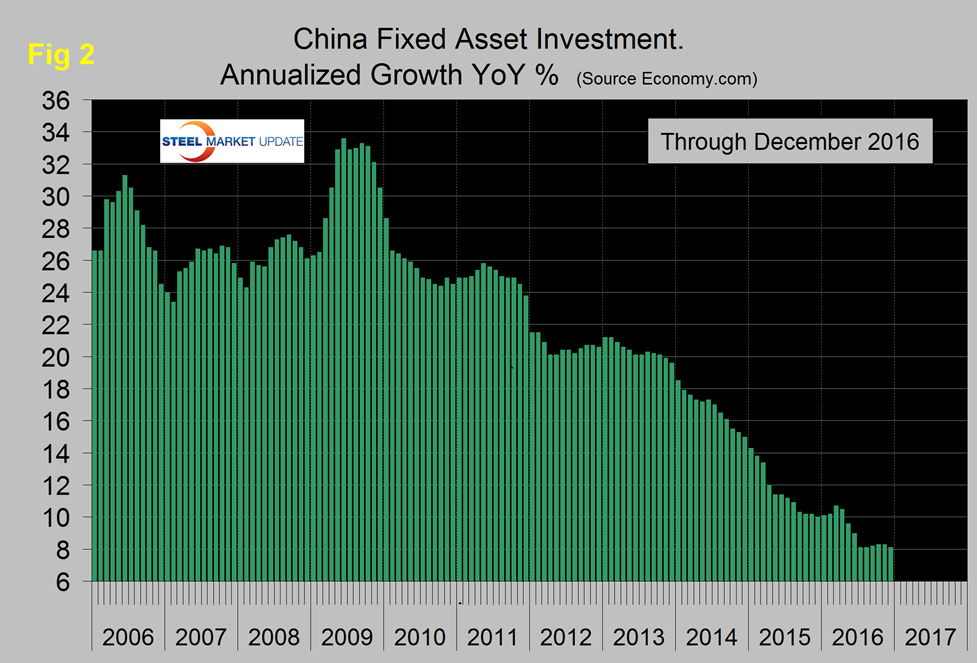
Figure 2 shows the growth of fixed asset investment y/y.
The growth slowdown experienced in 2013 accelerated through all of 2014 and through August of 2015. Growth leveled off in Q4 2015 and Q2 2016, dropped sharply then leveled off again in the second half of 2016. In December FAI grew at 8.1 percent y/y which means it is still doubling every 107 months. The lower growth rate is being propped up by public investment as private investment dwindles. Economy.com wrote: government finance remains the main driver of overall investment. The main drag on the bottom line figure is still mining which declined consistently in 2016 amidst low commodity prices and chronic overcapacity. The government has been attempting resolve these persistent issues by pledging to reduce steel production capacity by 100 million tonnes, to 150 million tonnes, by 2020. This will keep a lid on investment activity for the foreseeable future.
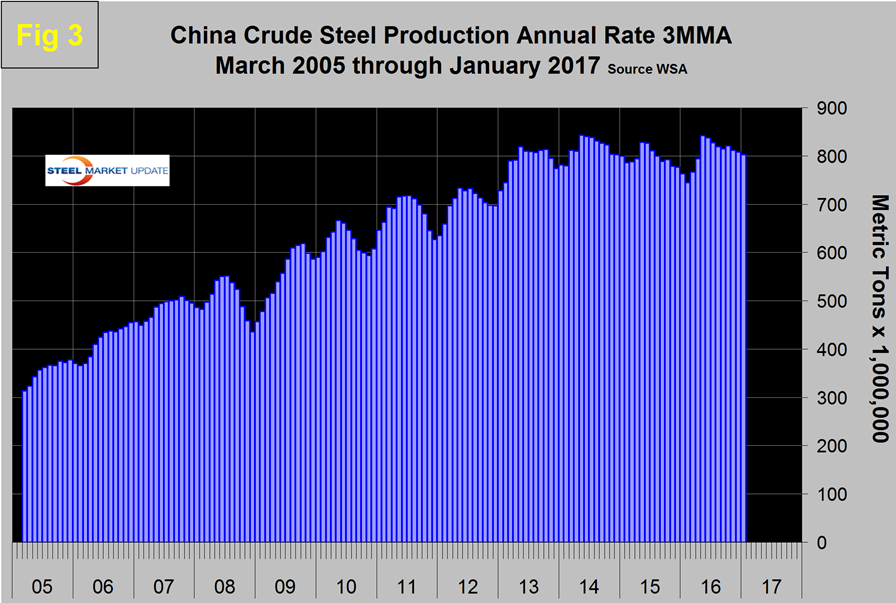
In this update we are re-playing charts that we first published in our analysis of global steel production. Figure 3 shows the 3MMA of China’s crude steel production since March 2005.
China’s production after slowing for 13 straight months on a 3MMA basis year over year returned to positive and accelerating growth each month in the May through January time frame and accounted for 49.2 percent of global production in January. The slowdown in Chinese steel production that the rest of the world has demanded is NOT happening. Another way of looking at the change in growth is shown in Figure 4.
The May through January results followed zero growth in April. In early November the Ministry of Industry and Information Technology stated that foreign companies will be encouraged to participate in the reorganization of Chinese steel companies. Under the plan, the amount of crude steel capacity in China is to be cut by up to 150 million tons, to less than one billion tons by 2020, as demand for the product drops. Any project that aims to expand steel production capacity will be banned. The plan also requires energy consumption in the steel industry to be reduced by more than 10 percent while major pollutants must be cut by more than 15 percent. The central government reiterated that cutting overcapacity is high on its reform agenda as excess capacity in sectors such as steel and coal has weighed on the country’s overall economic performance.
SMU Comment: We couldn’t contain ourselves when we read what Economy.com reported as a government statement in the 2nd paragraph above. This seems to be classic dis-information or as it’s now known as alternative facts. We estimate that global steel overcapacity is now about 460 million tonnes per year and of that a high proportion is in China who is now pushing more than the total of US steel production onto the world market. The November announcement by the Ministry of Industry and Information Technology is not encouraging if as implied, Chinese steel production falls in line with declining domestic demand. The rest of the world needs a much higher decline in production.


