Market Data

February 21, 2017
SMU Apparent Excess/Deficit Model Has January Inventories in Deficit
Written by John Packard
Late last week the MSCI released their service center shipment and inventories data. Steel Market Update (SMU) provides detailed articles to both our Executive and Premium members about the MSCI data. One of the special articles we do for Premium only customers is our Service Center Flat Rolled Inventories Apparent Excess/Deficit model.
This is a long-winded way of saying we put the data into our model and then pump out an opinion as to whether the domestic service centers have too much (Excess) or not enough (Deficit) sheet stock on their floors. Our model now has service center inventories in Apparent Deficit. This is critical to understand as deficits mean the distributors will need to buy more steel soon. Apparent Deficits are good for steel mills trying to raise steel prices.
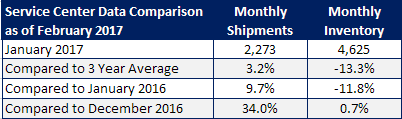
Our forecast for the month of January was for shipments of flat rolled to total 2,190,000 tons. The actual tonnage shipped exceeded our forecast by 83,000 tons. U.S. service centers shipped 2,273,000 tons of carbon flat rolled during the month of January 2017.
We also forecast final inventories of sheet stock would be 4,570,000 tons which would result in an Apparent Excess in distributor inventories of just 25,000 tons. The actual numbers had inventories at the end of January hitting 4,625,000 tons and instead of an Apparent Excess the distributors are now in Deficit with the Apparent Deficit based on our proprietary model being -67,000 tons. At the end of December, 2016 flat rolled inventories at the service centers had an Apparent Excess of +116,000 tons.
February & Beyond Forecast
Steel Market Update is changing the way we forecast as our desire is not to be able to predict the shipment rate or total inventory but rather to help our Premium members better understand what the end of the month data means and if there are any changes to the trends.
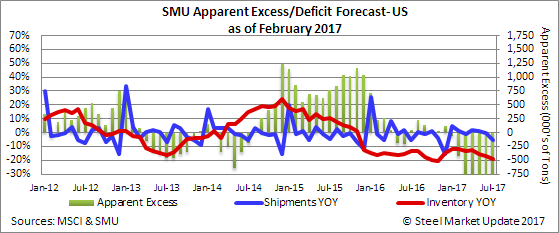
Going forward we are going to use the changes per month over month compared to the 4 year-moving-average in both shipments and receipts. The new forecast table will look like this:
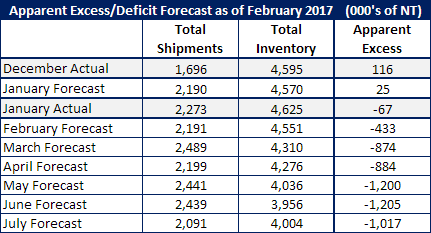
Can the inventory deficits really hit -1,200 tons. We have seen excesses in the past (usually too much inventory) and our opinion is there will be an adjustment to move inventories closer to a balanced situation. In order to do that there will need to be an expansion of domestic and/or foreign deliveries over the next few months. We will see how accurate our model is using the 4-year average month-to-month change.
We are going to discontinue forecasting HRC prices as that is not a normal part of our company and other than discussing the trends we are no better forecaster than one of the steel analysts who get paid a lot more money to provide their opinions.
When reporting the new data, we will analyze how we did against our model (using the 3 year moving average), how we did against the month prior (in this case December) as well as changes from the data released one year ago.