

Market Data

January 22, 2017
Oil and Gas Prices and Rotary Rig Counts
Written by Peter Wright
The prices of oil and natural gas drive the consumption of oil country tubular goods (OCTG) and related steel products. The energy markets represent a large portion of the hot rolled coil used to make pipe and tube as well as equipment used to drill and pump oil and natural gas.
Figure 1 shows historical oil and gas prices since January 2000.
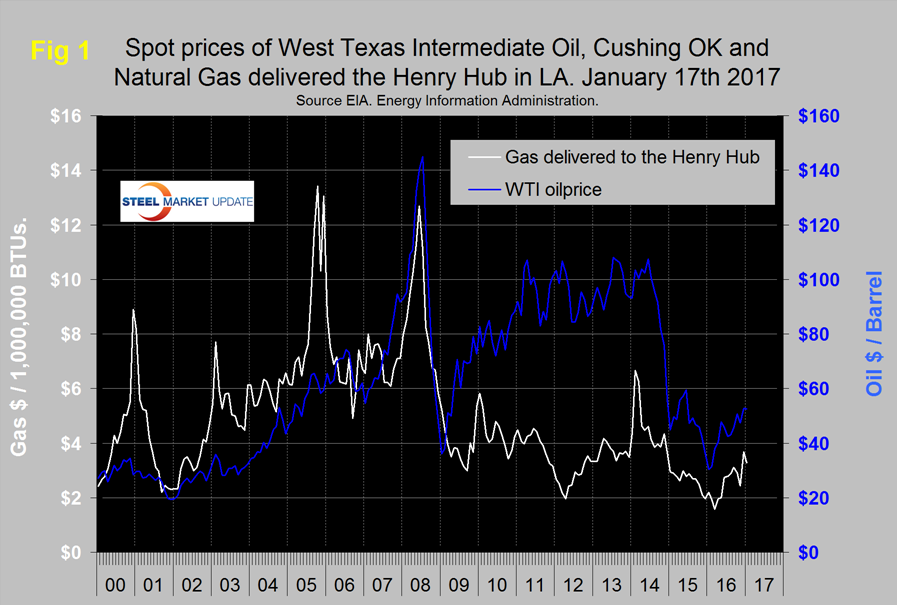
The daily spot price of West Texas Intermediate (WTI) rose through $50 on December 8th and has stayed above that level ever since. The price had a recent high of $54.01 on December 28th and settled back to $52.45 on January 17th, Brent closed at $54.68 on the same day. Data source is the Energy Information Administration (EIA).
The price of natural gas, delivered the Henry Hub had a recent low of $2.22 on November 11th but by December 7th had shot up to $3.69/MM BTU. By January 13th the price had slid back to $3.27. January 13th was the latest data for gas published by the EIA. The price of gas had trended down for two years prior to March 4th when it bottomed out at $1.57/MM BTU. Natural gas is expected to have fueled the largest share of electricity generation in 2016 at 33 percent, compared with 32 percent for coal. In 2017, natural gas and coal are both forecast to fuel 32 percent. President Trump will have the power to push new legislation and to remove old regulations. None of that will help to change the fundamental economics of coal which are increasingly pointing to more mine closures. Renewable power is consistently becoming cheaper, and the glut of natural gas continues to make it one of the most affordable power generation sources available. Appalachian coal has been in trouble for years because it is expensive to extract from the ground. In comparison, coal from the Powder River Basin in Wyoming is comparatively cheap to mine. Wyoming has vast deposits of easily accessible, low-sulfur coal, and that has historically been a significant source of power generation for many of the Mountain West states. In 2015 for instance, roughly half the region’s power generation was coal-fired. A decade ago, those states got nearly two-thirds of their power from coal. Figure 2 shows the proportion of energy produced by gas and coal since 1950.
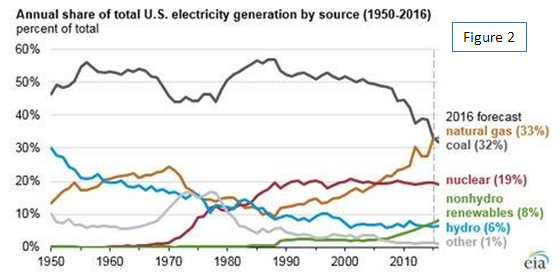
Figure 3 shows the apparent supply of the two main steel tubular products used in oil and gas production from January 2003 through October 2016 (apparent supply is a proxy for demand).
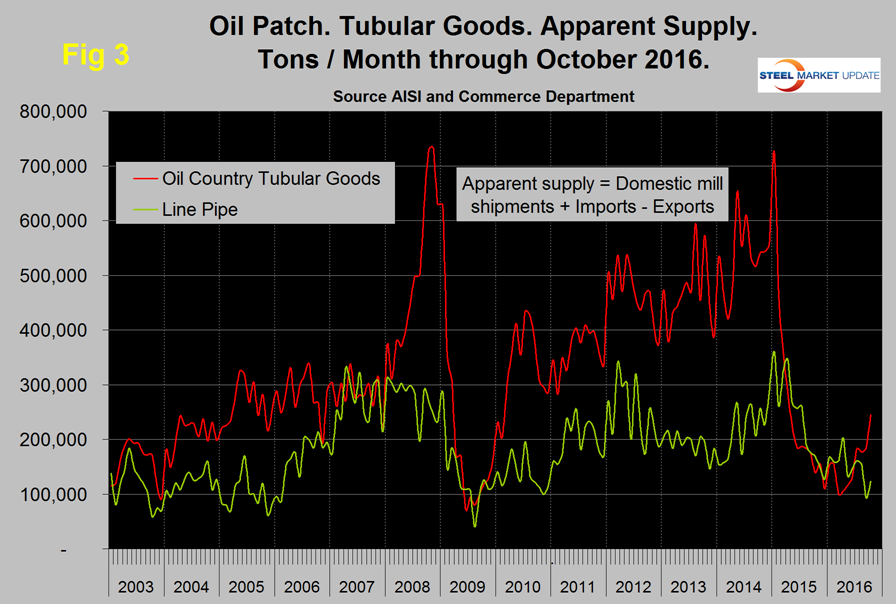
We apologize for not having November tubular steel data, the lack of which is due to an invasion by the Osiris blackmail virus that encrypted our data files then demanded 3 bitcoins ($2,700) to free them up. No we didn’t pay, but we did have to format our hard drive and lost some data. Line pipe demand has been trending down since April and it remains to be seen if the October advance will be sustained. In contrast, the supply of OCTD which had fallen in March to 99,600 tons recovered strongly through October when at 244,600 tons it was higher than at any time since July last year.
The total number of operating rigs in the US and Canada on January 20th was 1,035 which was up from a low of 445 on May 27th. The great news is that in the first three weeks of 2017, oil and gas rigs counts in both the US and Canada have positive year over year growth. It’s been two years since the US oil rig count has positive y/y growth and six years since that was the case for gas. Figure 4 shows the Baker Hughes US Rotary Rig Counts for oil and gas equipment in the US through January 20th (explanation below).
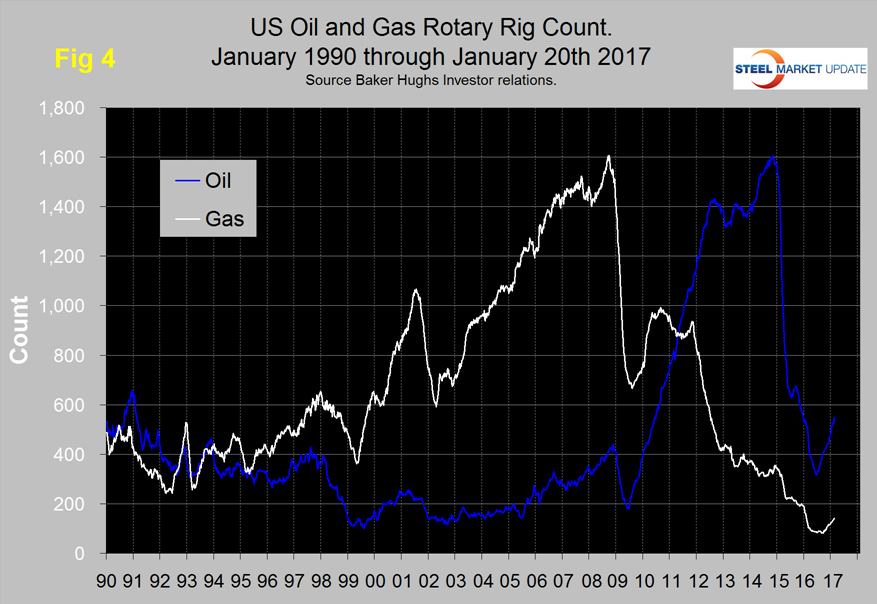
The uptick in the US oil rig count is now well established having increased from 316 on May 27th to 551 on January 20th. The gas rig count is gaining traction and on January 20th was 142, up from a low point of 81 on August 5th.
On a regional basis in the US, the big three states for operating rigs are Texas, Oklahoma and North Dakota. Texas at 341 on January 20th was up from a low point of 173 on June 20th and up from 318 in January last year. Oklahoma at 91 on January 20th was up from its low point of 54 on June 24th and up from 87 y/y. North Dakota at 35 on January 20th was up from its low point of 22 on June 3rd but still down from 49 at the beginning of 2016.
Baker Hughes Rotary Rig Count: These are a weekly census of the number of drilling rigs actively exploring for or developing oil or natural gas in the United States. Rigs are considered active from the time they break ground until the time they reach their target depth and may be establishing a new well or sidetracking an existing one. The Baker Hughes Rotary Rig count includes only those rigs that are significant consumers of oilfield services and supplies.


