

Market Data

December 18, 2016
Energy Markets Still a Silver Lining for the Steel Industry
Written by Peter Wright
The prices of oil and natural gas drive the consumption of oil country tubular goods (OCTG) and related steel products. The energy markets represent a large portion of the hot rolled coil used to make pipe and tube as well as equipment used to drill and pump oil and natural gas.
On December 12th Gaurav Agnihotri wrote, “On December 10th, OPEC and non-OPEC producers signed their first oil production agreement in Vienna in fifteen years. The outcome of this meeting between OPEC and non -OPEC members will definitely support oil prices in the near future. However, the deal also signifies the fact that Saudi Arabia has been defeated by the U.S shale industry in its oil price war. The Saudis started pumping the markets with oil in 2014 in order to drive the U.S shale drillers out of business. That did not happen, and the U.S shale industry turned out to be more resilient that the Saudis could have ever imagined. In fact, with its rising fiscal deficit and a generous public spending, cheap oil has affected Saudi Arabia’s economy in such a way that the country is now trying to develop its non-oil based sectors. This is the reason why the probability of Saudi Arabia dominated – OPEC sticking to its commitment to production cuts is high.”
Figure 1 shows historical oil and gas prices since January 2000. The daily spot price of West Texas Intermediate, (WTI) rose through $50 on December 5th and closed at $52.74 on the 12th. Except for a few odd days, this was the first time for WTI to break through $50 since mid-2015 and that was short lived. According to the Energy Information Administration, (EIA). Brent closed at $53.99 on the same day.
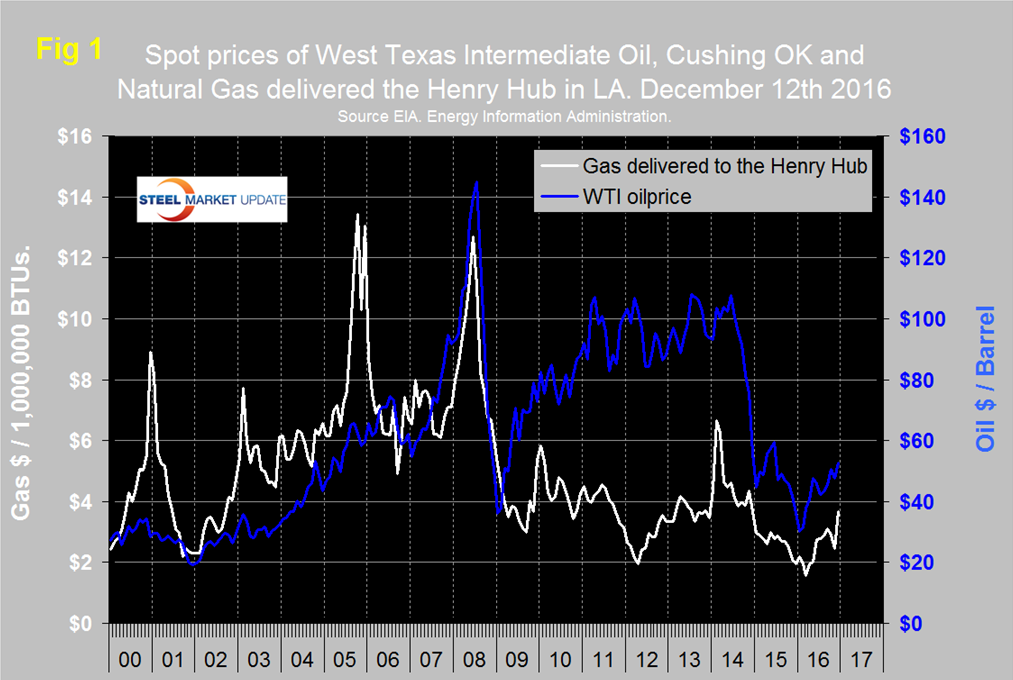
The price of natural gas, delivered the Henry Hub had a recent low of $2.22 on November 11th but by December 7th had shot up to $3.69 / MM BTU. December 7th was the latest data published by the EIA. The price of gas had trended down for two years prior to March 14th and was below $2.00 in March and April. Natural gas is expected to fuel the largest share of electricity generation in 2016 at 33 percent, compared with 32 percent for coal and in 2017, natural gas and coal are both forecast to fuel 32 percent.
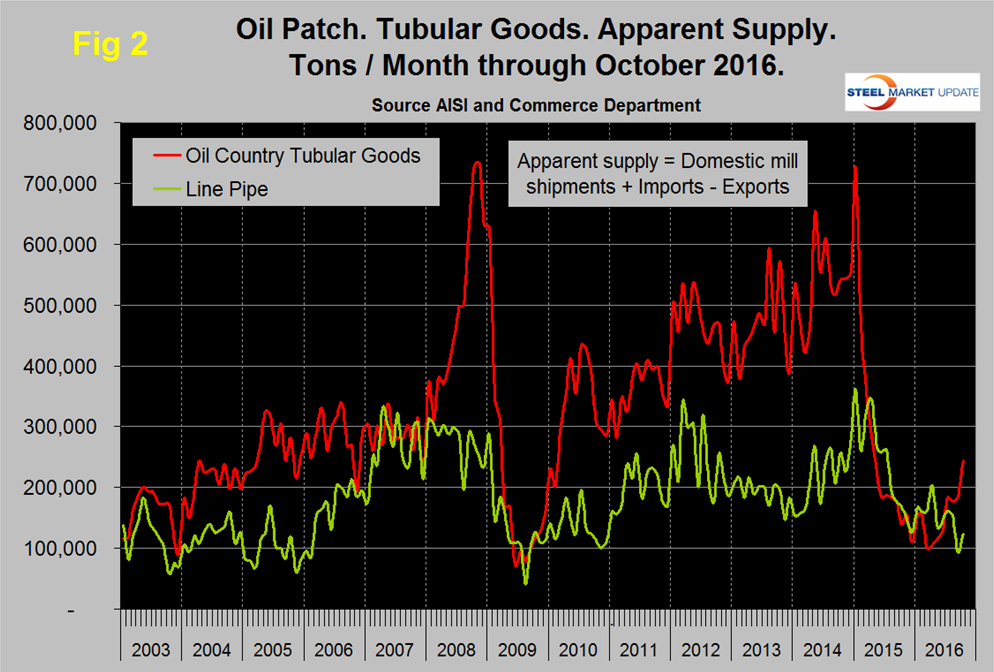
Figure 2 shows the apparent supply of the two main steel tubular products used in oil and gas production from January 2003 through October 2016. (Apparent supply is a proxy for demand.) Line pipe demand has been trending down since April and it remains to be seen if the October advance will be sustained. In contrast, the supply of OCTD which had fallen in March to 99,600 tons recovered strongly through October when at 244,600 tons it was higher than at any time since July last year.
The total number of operating rigs in the US and Canada on December 16th was 868, up from a low of 445 on May 27th. In that time frame the oil rig count was up from 330 to 626 and the gas count was up from 115 to 242. Figure 3 shows the Baker Hughes US Rotary Rig Counts for oil and gas equipment in the US through December 16th (explanation below).
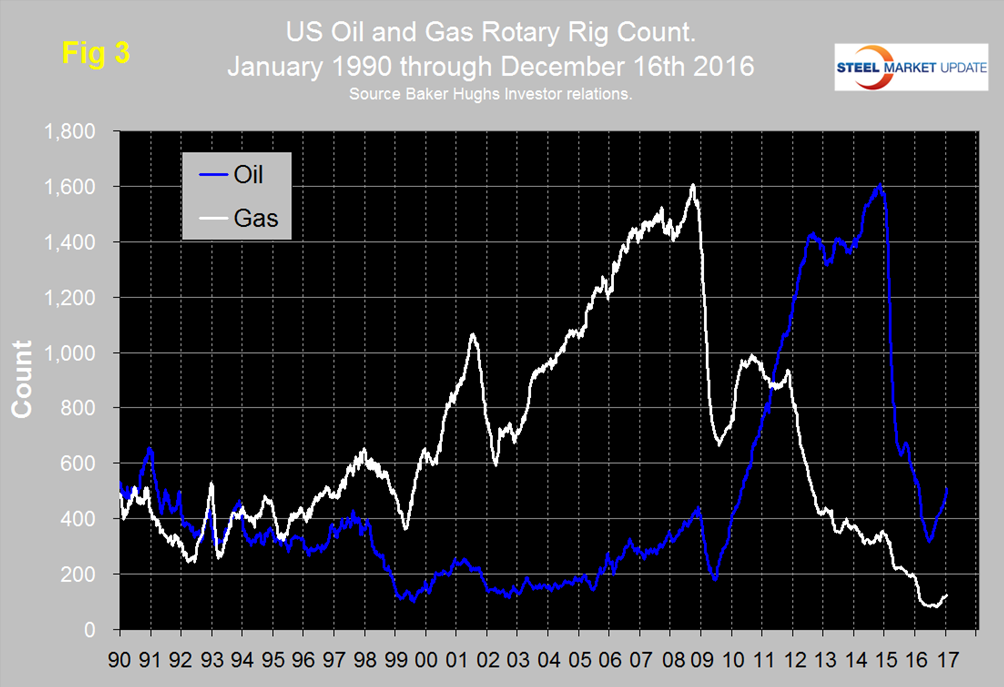
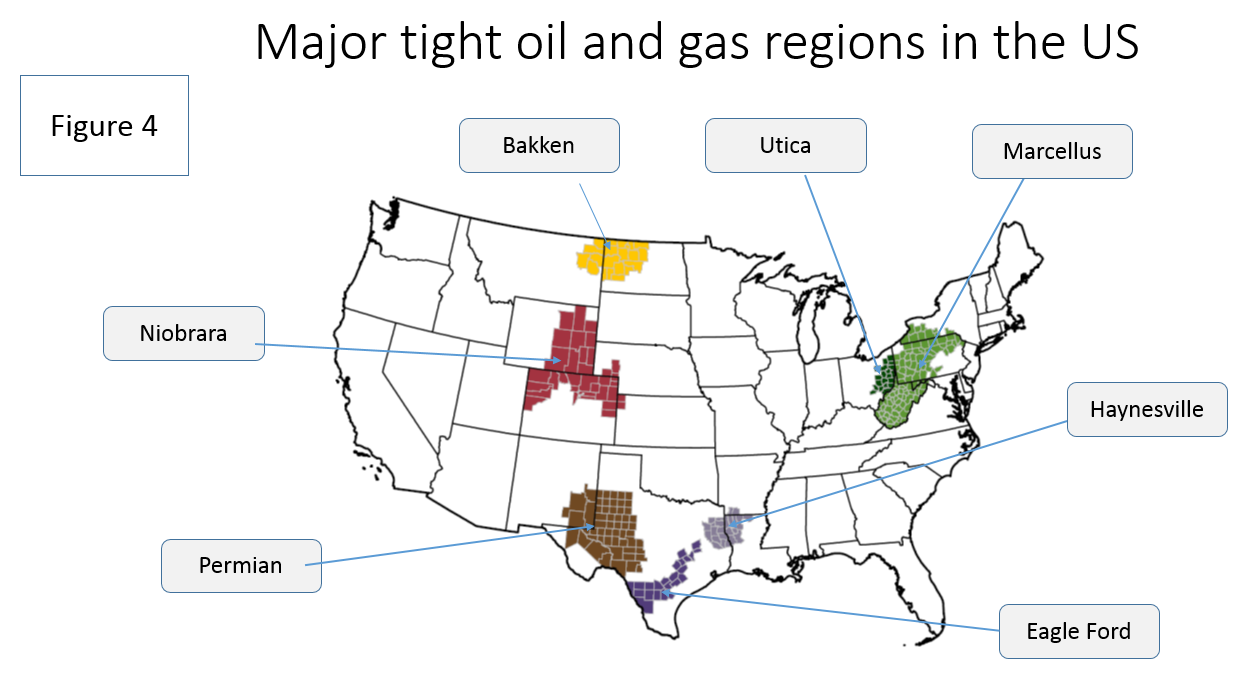
The uptick in the US oil rig count was the first since August of last year and now seems to be well established having increased from 316 on May 27th to 510 on December 16th. The gas rig count is gaining traction. Of relevance is the increase not only in the Permian but also in several shale producing regions. We believe that with oil prices back above $50/bbl and with supply and demand (but not inventories) balancing somewhere during the first half of 2017, we should see capital coming back to several shale plays during the following months. Last week we came across a map of the US showing the main shale producing regions and thought it would be of interest to readers who, if they are like us, hear these names and don’t necessarily know where the fields are located. The map is reproduced here and, unfortunately, doesn’t include Wolfcamp (see below), Figure 4.
On November 17th Gary Bourgeault wrote: “A fact not too many investors know is that the U.S. has been the global market leader since 2012 for the production of oil and natural gas, according to the U.S. Energy Information Administration. I not only believe that is going to continue, but the U.S. will widen its lead over competitors going forward. In September Apache Corp. said it had discovered about 3 billion barrels of oil and 75 trillion cubic feet of natural gas in what it identifies as Alpine High. That area was considered too little value to producers, reinforcing the fact there is a lot more oil in the U.S. to be found. Following on that is the latest discovery by the U.S. Geological Survey, which said it has discovered another 20 billion barrels of oil and 16 trillion cubic feet of natural gas in the Wolfcamp; located in West Texas. This is an area that has already yielded billions of barrels of oil. The discovery of about 23 billion barrels of oil is only the tip of the iceberg in my opinion, based upon the high-percentage probability of former conventional drilling sites having billions of barrels more in them. There is also the possibility, as in the case of Apache, of companies finding a lot more oil in unsuspecting places. Add to that the opening of federal lands to exploration and assessment, and my conclusion is there is going to be a surprising amount of new oil discovered onshore in the U.S. in the years ahead, and the improved technology and methodology will allow companies to profitably extract it various price points.
“Something else to consider is the vast amount of natural gas produced from the drilling process for oil. Many investors aren’t taking that into account – especially concerning the downward pressure it could continue to have on natural gas prices. Taken together though, this is a positive for the U.S. shale industry. Shale producers already holding significant assets in the Wolfcamp, for the most part, should upwardly revise their recoverable reserves, along with the amount of oil being produced from the premium wells they’re now completing. This will result in surprises to the upside over the next several quarters, as the U.S. shale industry ramps up production and continues to solidify its position as the new swing producer in the industry. As for individual upstream shale companies, I would assume most of them are going to do much better than expected, specifically with those having significant exposure to the Wolfcamp. I believe this won’t be the only basin where more oil is discovered. As more locations are assessed, we’ll find there are billions more barrels of oil those operating in the U.S. will be able to supply the market with. We’re still in the early stages of the U.S. shale revolution, with a lot more to come.”
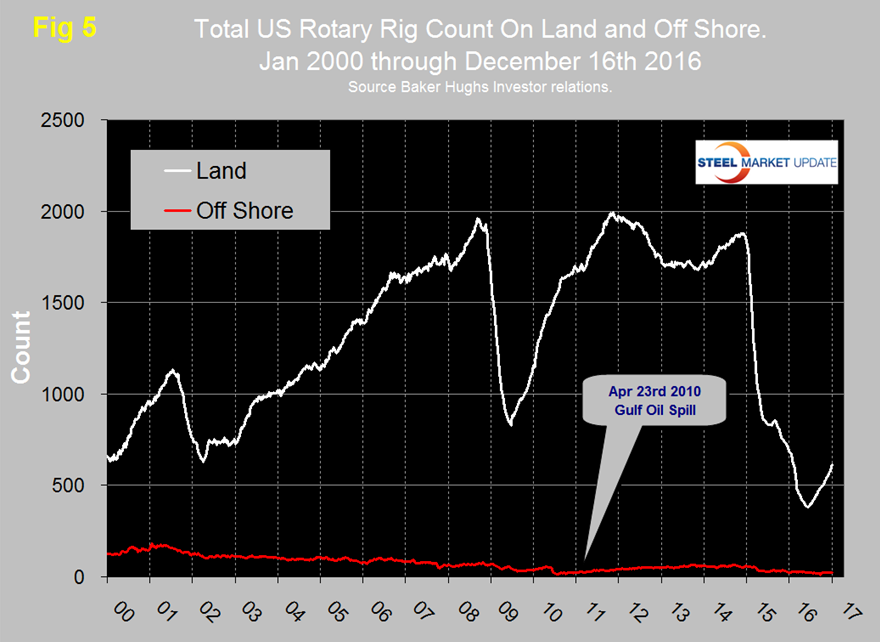
Based on the most recent available data, the EIA estimates that oil production from hydraulically fractured wells now makes up about half of total U.S. crude oil production. The offshore US rig count peaked at 66 on August 29th 2014 immediately before the oil price crash. Since then the offshore count steadily declined to 10 on September 2nd before recovering to 22 on September 22nd where it has stayed ever since (Figure 5).
On a regional basis in the US, the big three states for operating rigs are Texas, Oklahoma and North Dakota. Texas at 316 on December 16th was up from a low point of 173 on June 20th and almost back to 318 where it was at the beginning of the year. Oklahoma at 78 on December 16th was up from its low point of 54 on June 24th but down from 87 at the beginning of the year. North Dakota at 31 on December 16th was up from its low point of 22 on June 3rd but down from 53 at the beginning of the year.
Baker Hughes rotary rig count: These are a weekly census of the number of drilling rigs actively exploring for or developing oil or natural gas in the United States. Rigs are considered active from the time they break ground until the time they reach their target depth and may be establishing a new well or sidetracking an existing one. The Baker Hughes Rotary Rig count includes only those rigs that are significant consumers of oilfield services and supplies.


