Market Data

November 28, 2016
Industrial Production and Manufacturing Capacity Utilization
Written by Peter Wright
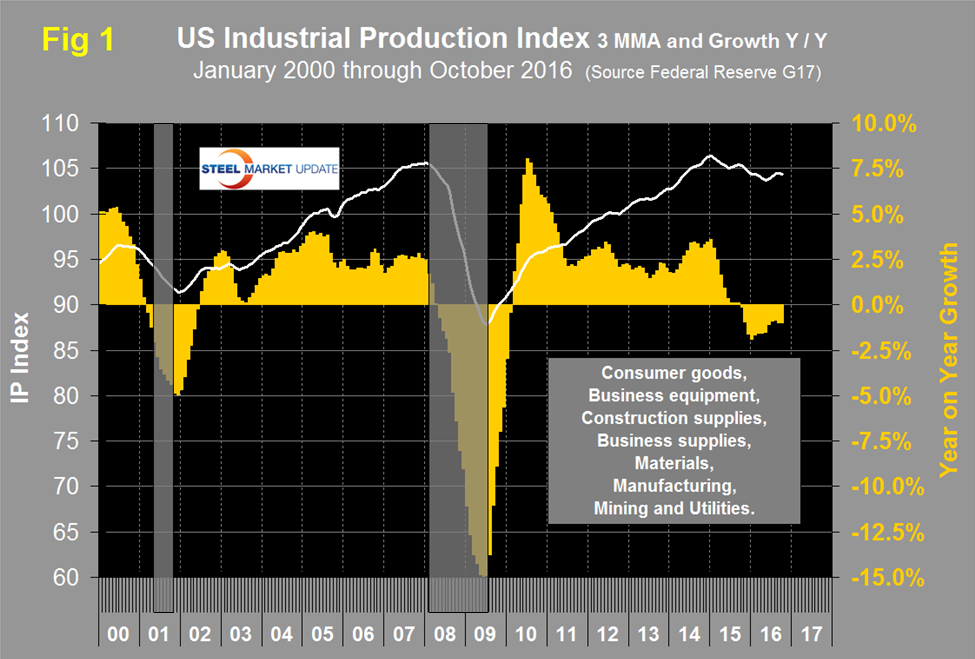
Both these data points are reported in the Federal Reserve G17 data base. The three month moving average (3MMA) of the index had an all-time high of 106.28 in December 2014 and trended down through June this year when it experienced a three month turnaround followed by a slight decline in October to 104.32. Figure 1 shows the 3MMA of the index and the Y/Y growth.
On a Y/Y basis the decline has been slowing this year. Data is seasonally adjusted and the index is based on the May 2012 level being defined as 100. In October the M/M growth on a 3MMA basis, was negative 0.1 percent following four months of slight positive growth. However growth on a Y/Y basis was negative 0.98 percent. This means that momentum is positive since the short term performance (3 months) was better than the longer term (12 months). We place less emphasis on the actual numbers than we do direction and we conclude that the October data suggests an improvement in industrial production. Momentum has been positive for 15 straight months.
The US dollar posted sharp gains on Wednesday, bolstered by excellent durable goods reports. Core Durable Goods Orders rose 1.0 percent, well above the estimate of 0.2 percent. Durable Goods Orders surged 4.8 percent, crushing the estimate of 1.2 percent. These strong numbers point to a welcome improvement in business investment, and strong consumer fundamentals could see business spending numbers continue to improve. There was positive news on the consumer front, as the University of Michigan Consumer Sentiment index climbed to 93.8, above the forecast of 91.6.
The October 19th update of the Federal Reserve Beige Book had this to say about manufacturing: “Reports on the manufacturing sector were quite varied across Districts. The Boston, Philadelphia, Chicago, Kansas City, and Dallas Districts noted increased factory activity, while activity declined in the Richmond and Atlanta Districts and was steady to weaker in the New York District. The remaining Districts cited flat or mixed activity. Capital expenditures were also mixed. Spending cutbacks accelerated in the Cleveland District, and future spending plans lowered in the Philadelphia District but rose to the highest level in more than a year in the Kansas City District. Outlooks were generally positive, although the strong dollar continued to depress exports of manufactured goods in some Districts. Looking across the manufacturing sector, transportation manufacturing was a bright spot with strong growth reported in the Chicago and Dallas Districts, and the Cleveland District reported elevated activity for motor vehicle and aerospace suppliers. Growth in fabricated metals manufacturing was also a common trend, seen in the Philadelphia, Kansas City, and San Francisco Districts. Steel, demand fell in the Cleveland District and production weakened in the San Francisco District, where contacts noted that the elevated dollar, strong global production, and weak economic growth held back exports. There were several reports of continued weakness in the oil and gas sector still hurting demand for energy-related machinery and/or metal products in the Boston, Chicago, St. Louis, and Dallas Districts.”
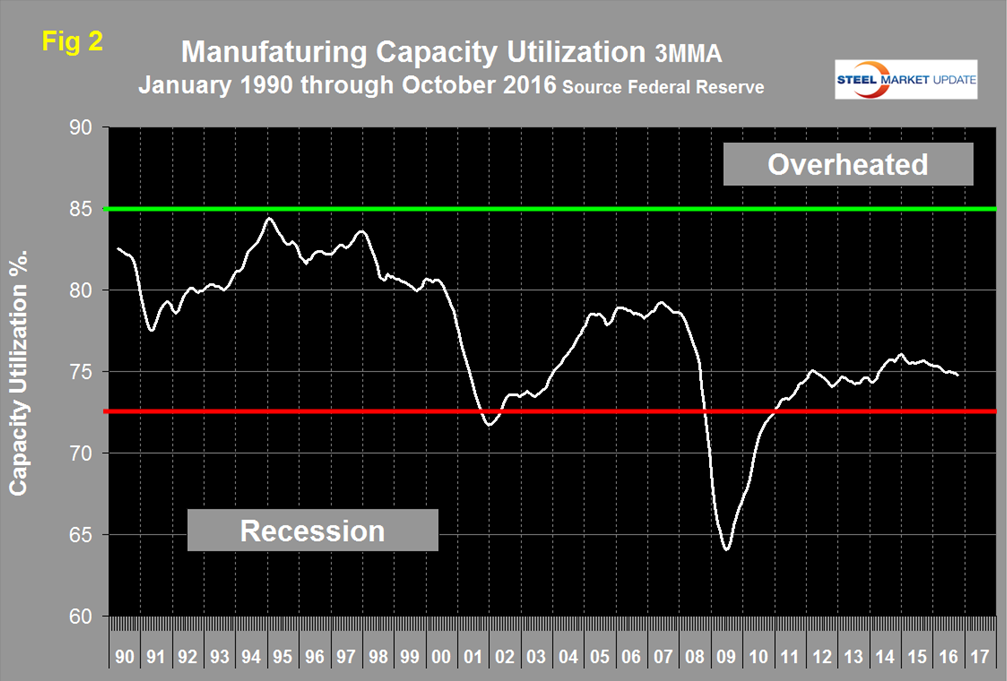
Manufacturing capacity utilization was 74.9 percent in October with a 3MMA of 74.8 percent (Figure 2). In January last year, utilization exceeded 76 percent for the first time since the recession and has been slowly declining ever since.
SMU Comment: In March this year the ISM manufacturing index signaled positive growth by exceeding 50 for the first time since October 2015 and had five positive months through July. It dipped below the 50 mark in August and had a value > 50 in September and October when it reached 51.9 with a 3MMA of 50.9 (Figure 3). We regard the ISM index as “leading” therefore combined with positive momentum in the IP index our expectations for manufacturing in the short term are positive. At SMU we try to examine two or three measures of the same activity as a reality check and on this basis manufacturing is flashing green.


