Market Data

November 27, 2016
Mill Lead Time History from Manufacturer/Service Centers Points of View
Written by John Packard
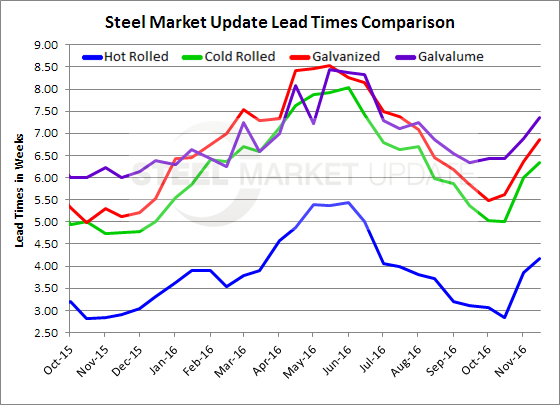
Every two weeks Steel Market Update publishes an analysis of flat rolled steel mill lead times by product. In our last newsletter we told our readers that those responding to our questionnaire just before Thanksgiving said hot rolled lead times were averaging 4.18 weeks from the time a new order is placed until the steel is ready to ship at the domestic steel mill.
They are reporting cold rolled as averaging 6.35 weeks, galvanized as averaging 6.85 weeks and Galvalume as averaging 7.36 weeks. We put this information into a handy graphic (see below) which makes it easy to understand.

However, for our Premium level readers we provide even more detail that you might find interesting as you strive to better understand and compare today’s market on a historical basis. We do this through the eyes of our manufacturing companies as well as our service centers because the two groups are not always treated equally by their domestic steel suppliers.
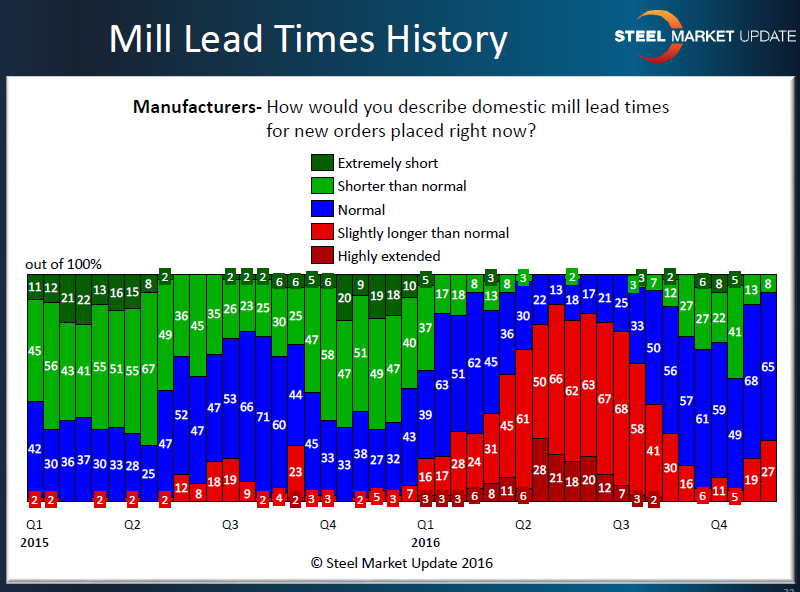
In the graphic below we isolate manufacturers who are reporting lead times as basically being “normal” or slightly better than normal as 73 percent of the manufacturing respondents reported lead times as normal or, shorter than normal. Only 27 percent of the respondents reported lead times as slightly longer than normal. This is similar to the results we were seeing back in early 1st Quarter just as steel prices began their move off the December lows.
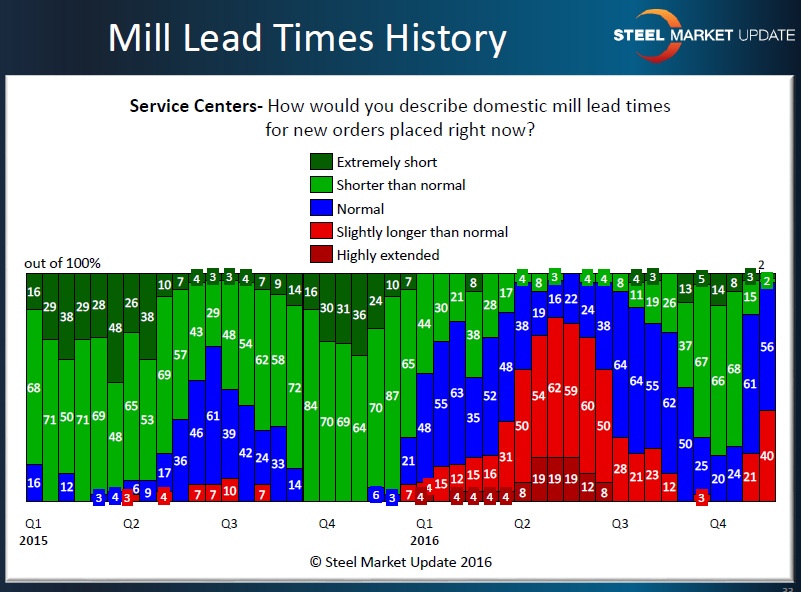
Service centers are reacting to this latest cycle a little differently than what they were reporting at the beginning of January 2016. We are already seeing 40 percent of the distributors reporting slightly longer than normal lead times. We did not reach that level in the last “up” cycle until early in the second quarter. So, early on we are seeing the flat rolled steel distributors/wholesalers more concerned than what they were reporting to SMU back in late December 2015/early January 2016 which was the beginning of the last “up” cycle prior to the one we are in now.


