Prices

November 19, 2016
Global Steel Production in October and Forecast through 2017
Written by Peter Wright
The World Steel Association (WSA) released their provisional October update of global steel production on Friday with the proviso that several countries were late in reporting. When this happens they plug in the missing numbers and, based on our review of past assumptions, we believe their preliminary report is credible. We are, therefore, going ahead with this analysis because we believe it is so important to our understanding of the markets that we live in.
Production in the month of October at 136,181,000 metric tons was up by 2.4 percent from September and the three month moving average (3MMA), that we prefer as a measure, was up by 0.6 percent from September. Capacity is 2.35 billion tonnes per year and the 3MMA of capacity utilization in October was 69.6 percent. Figure 1 shows monthly production and capacity utilization since January 2000.
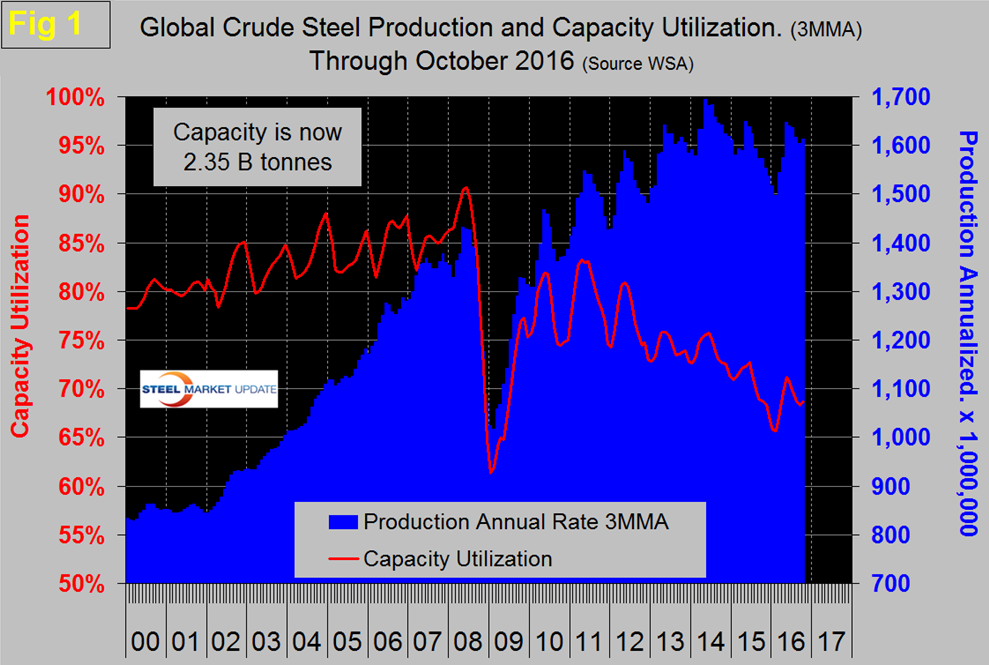
On a tons per day basis, production in October was 4.393 million tonnes with a 3MMA of 4.385, up by 0.61 percent from September. Since 2011, capacity utilization has been on a steadily downward trajectory with an upward blip in the first few months of 2016. On October 9th the OECD’s steel committee reported that global capacity is expected to increase by almost 58 million tonnes/year between 2016 and 2018 bringing the total to 2.43 billion tonnes.
As we dig deeper into what is going on we start with seasonality. Global production has peaked in the summer for the last seven years including 2016. Figure 2 shows the average monthly production by month since 2008.
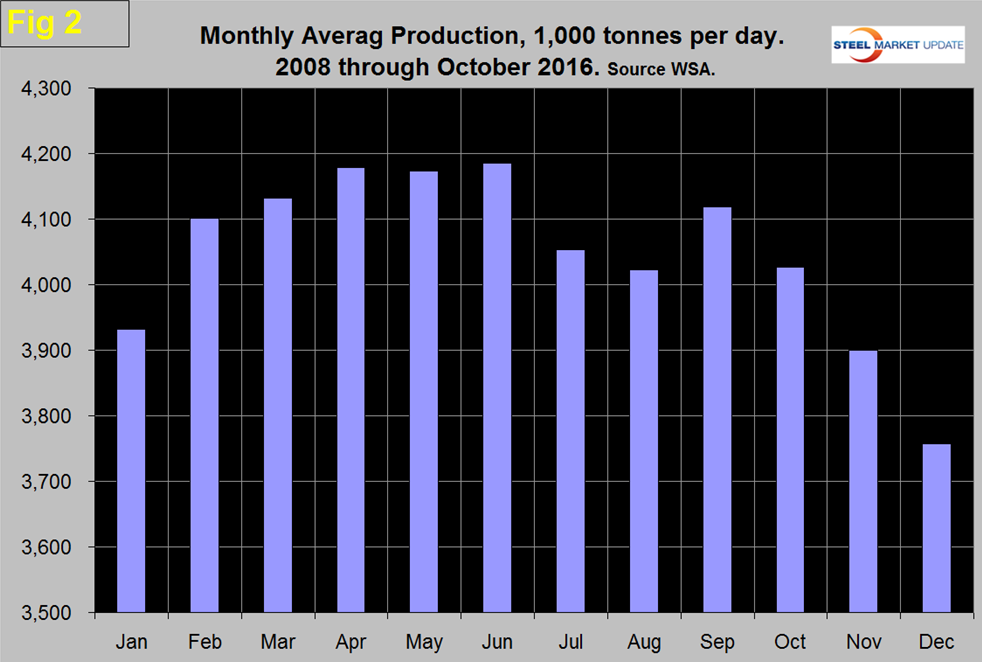
In those nine years on average, October has declined by 2.6 percent, this year October was down by 0.9 percent. We expect that, if history continues to be an accurate guide, there will be significant declines in November and December which historically over the last nine years were down by 3.1 percent and 3.65, respectively. We believe it’s necessary to look at the year over year change in the three month moving average to eliminate seasonality and, on this basis, October was disappointing in that production increased by 2.5 percent. Figure 3 shows the change in growth rate since January 2005.
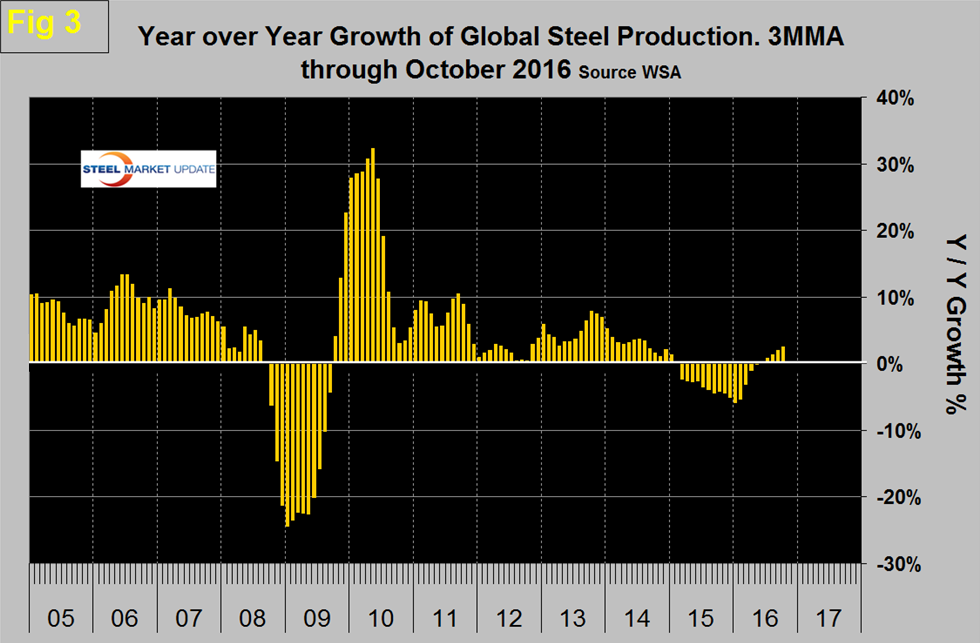
Production began to contract in March last year and the contraction accelerated through January this year when it reached 5.8 percent. In the next four months contraction slowed and in May and June was zero. July, August, September and October have had year over year increases in the 3MMA of 0.8 percent, 1.4 percent, 2.0 percent and 2.5 percent. The much desired slowdown in global steel production has reversed course on a year over year basis and is accelerating. China has been the driver.
Table 1 shows global production broken down into regions and also the production of the top ten nations in the single month of October and their share of the global total. It also shows the latest three months and twelve months production through October with year over year growth rates for each period. Regions are shown in white font and individual nations in beige.
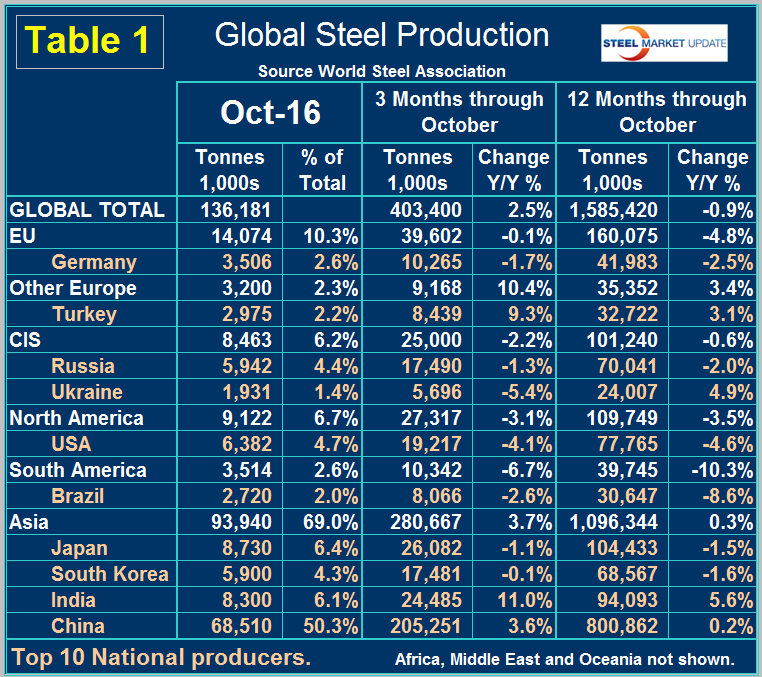
The world as a whole had positive growth of 2.5 percent in 3 months and negative 0.9 percent in 12 months through October. If the three month growth rate exceeds the twelve month, we interpret this to be a sign of positive momentum which has been the case for the last nine months.
Figure 4 shows China’s production since 2005 and Figure 5 shows the y/y growth.
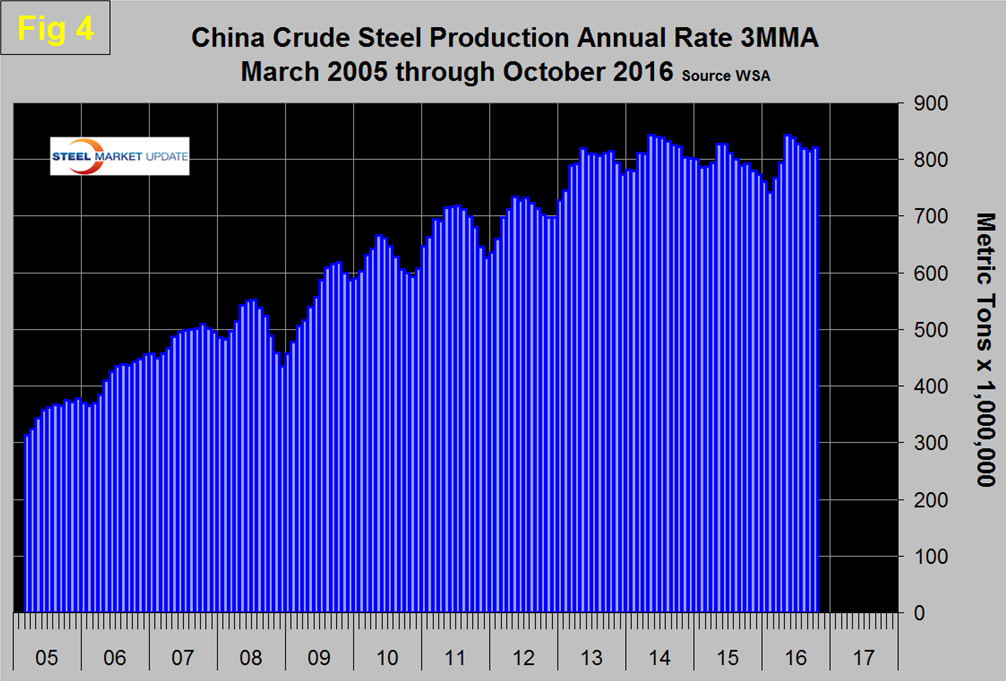
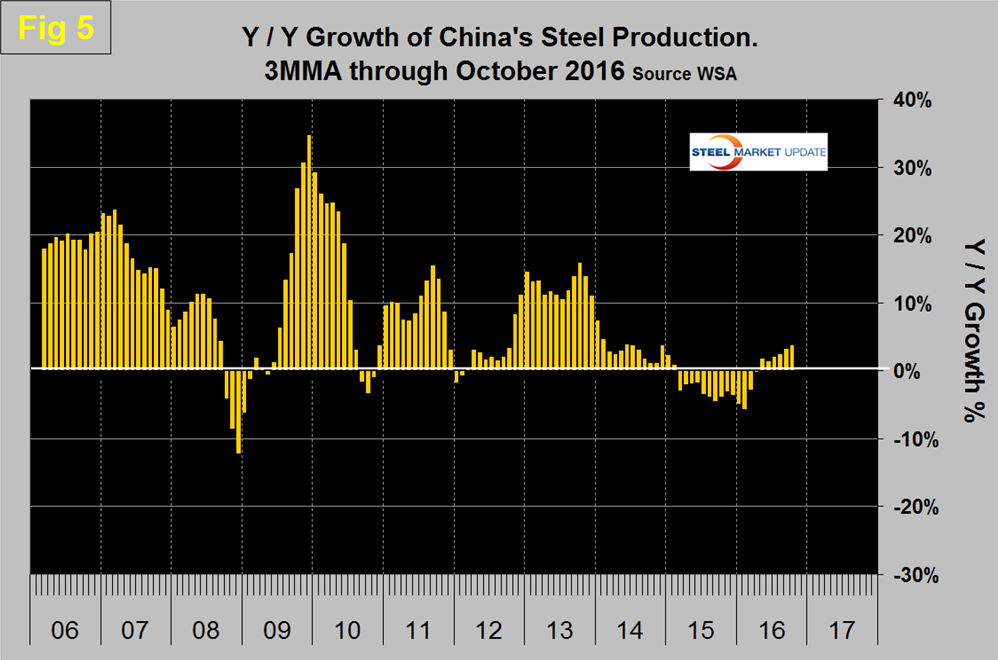
China’s production after slowing for 13 straight months on a 3MMA basis year over year returned to positive growth each month in the May through October time frame and accounted for 50.3 percent of global production in October. The slowdown in Chinese steel production that the rest of the world has demanded is NOT happening.
In a plan to cut crude steel production released by the Ministry of Industry and Information Technology on Monday, foreign companies will be encouraged to participate in the reorganization of Chinese steel companies. Under the plan, the amount of crude steel capacity in China is to be cut by up to 150 million tons, to less than one billion tons by 2020, as demand for the product drops. Any project that aims to expand steel production capacity will be banned.
The domestic consumption of crude steel is expected to be 650-700 million tons by 2020, less than the estimated output of 750-800 million tons. The plan also requires energy consumption in the steel industry to be reduced by more than 10 percent while major pollutants must be cut by more than 15 percent. The central government reiterated that cutting overcapacity is high on its reform agenda as excess capacity in sectors such as steel and coal has weighed on the country’s overall economic performance. The National Development and Reform Commission said Friday that the steel industry had completed its annual target of reducing production capacity by 45 million tons by the end of October.
Our response is that reducing capacity is not the same thing as reducing production and there is no sign that the reported capacity reduction (if it is for real) is having any effect on output. To put this into perspective with the rest of the world, on a 3MMA basis year over year through October, China had 3.6 percent growth as the rest of the world grew by 1.4 percent. On a rolling 12 months basis through October, China was up by 0.2 percent as the world as a whole was down by 0.9 percent.
On a regional basis in 3 months through October year over year, South America, the EU, North America and the CIS contracted. Asia as a whole was up by 3.7 percent with India up by 11.0 percent. Other Europe (mainly Turkey), was up by 10.4 percent and North America was down by 3.1 percent. Within North America the US was down by 4.1 percent, Canada was down by 0.2 percent and Mexico up by 3.8 percent.
The October 2016 version of the World Steel Association Short Range Outlook (SRO) for apparent steel consumption in 2016 and 2017 forecast a global growth of 0.2 percent this year and 0.5 percent next. Note this forecast is steel consumption, not crude steel production which is the main thrust of what you are reading now. Based on this forecast, NAFTA will contract by 0.1 percent this year and grow by 2.9 percent next. China’s demand will decline by 1.0 percent this year and 2.0 percent in 2017, therefore, if their production doesn’t decline by at least that amount, the flood of exports will only increase. The WSA forecast for the top 10 steel producing nations has the US down by 1.2 percent in 2016 and up by 3.0 percent next year.
SMU Comment: Evidently China is picking up the pace again as the rest of the world has contracted for 18 straight months through July and experienced 0.4 percent growth in August, 0.8 percent in September and 1.4 percent in October. Most of the ROW growth occurred in Turkey and India. With a global capacity utilization of 69.6 percent in October it is evident that capacity reductions have a long way to go before they begin to reduce the market pressure of over production. According to the OECD, capacity will continue to increase through 2018. To make matters worse, global economic growth is slowing and the Chinese currency is weakening. We repeat what we have said before and still believe, that oversupply and low capacity utilization won’t be resolved until well into the next decade. The forecast of a 3.0 percent demand increase in the US next year is optimistic based on the IMF forecast for US GDP growth in 2017.
Source: World Steel Association with analysis by SMU