

Market Data

November 16, 2016
Oil and Gas Prices and Rotary Rig Counts through November 2016
Written by Peter Wright
The prices of oil and natural gas drive the consumption of oil country tubular goods (OCTG) and related steel products. The energy markets represent a large portion of the hot rolled coil used to make pipe and tube as well as equipment used to drill and pump oil and natural gas.
OPEC is in disarray. At the historic meeting in Algiers on September 28th, Algeria was appointed as chair of the Technical Committee. Its primary responsibility was to define the production-cut mechanisms in each member country as part of the implementation of the decision taken at the meeting. Further meetings took place in Vienna on October 28th and 29th at the OPEC headquarters. These meetings were nonproductive. Instead, on November 14th Iran announced that it intends to increase production in certain fields by 750,000 b/d, but it needs more investment and technology. With a little more than two weeks to go before the end of November OPEC meeting, there is no mechanism to implement a cut to 32.5 to 33.0 million barrels of oil a day. Last week, OPEC disclosed that its members produced 33.6 million barrels per day in October and it is difficult to see which countries would cut production, since Libya, Nigeria, Iraq and Iran have all refused. Saudi Arabia, Kuwait and UAE are the only candidates.
On November 8th Robert Boslego wrote, “OPEC released its new World Oil Outlook today. It is not as optimistic as it was a year ago about its future. Although OPEC says its price assumptions are not a forecast nor a “desired path for crude,” it is expecting much lower prices than it had just a year ago. It assumes its OPEC Reference Basket (ORB) will average $45 in 2017 and gradually increase by $5 per year through 2021. That implies it will not be until 2020 that crude reaches $60 per barrel.
Figure 1 shows historical oil and gas prices since January 2000.
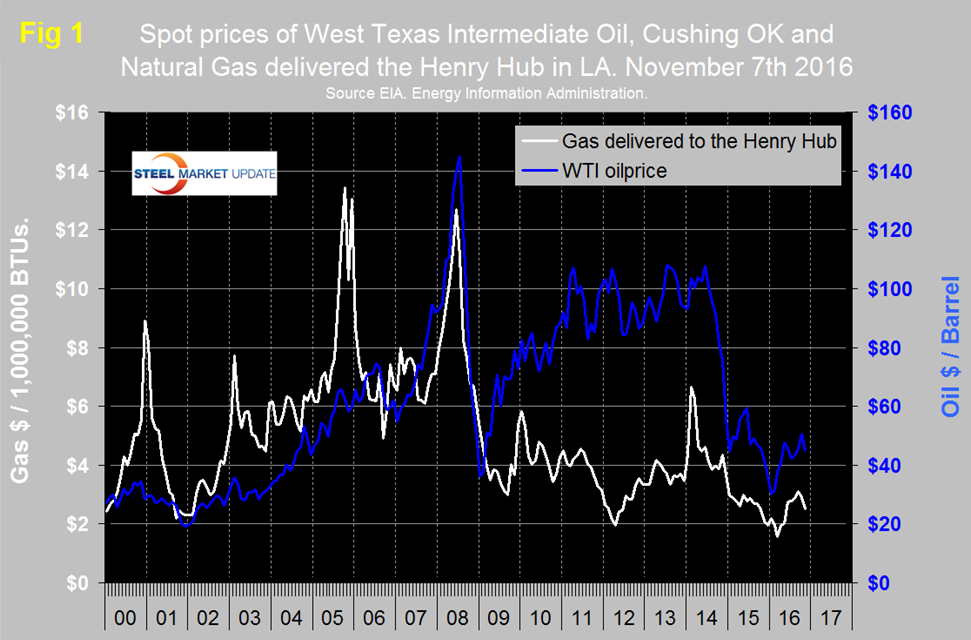
The daily spot price of West Texas Intermediate (WTI) rose through $40 on April 11th and remained in the $40s except for 3 days in June, the 7th through the 9th when it broke through the $50 level and one day, August 2nd when it dipped to $39.50. On October 5th WTI once again broke through $50 but in the latest figures for November 7th WTI closed at $44.88 according to the Energy Information Administration (EIA). Brent closed at $42.83 on the same day.
The price of natural gas, delivered the Henry Hub in Louisiana broke through the $3.00 level on September 16th and by October 14th had reached $3.17/MM BTU but by November 4th had fallen back to $2.50. November 4th was the latest data published by the EIA. The price of gas had trended down for two years prior to March 14th and was below $2.00 in March and April. Natural gas is expected to fuel the largest share of electricity generation in 2016 at 33 percent, compared with 32 percent for coal and in 2017, natural gas and coal are both forecast to fuel 32 percent.
Figure 2 shows the apparent supply of the two main steel tubular products used in oil and gas production from January 2003 through September 2016. (Apparent supply is a proxy for demand.)
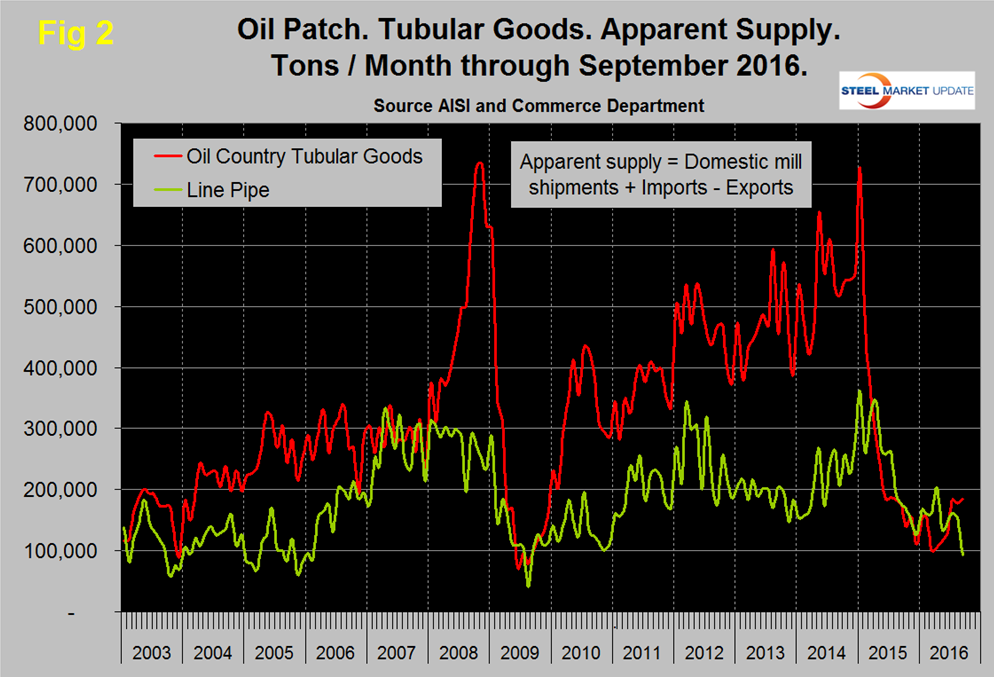
Following a weak December, line pipe demand advanced with the rising oil price, dived abruptly in May, recovered slightly but in the latest data from AISI for September had again declined to the point that it was lower than any time since mid-2009. In contrast the supply of OCTD, which had fallen in March to 99,600 tons, recovered strongly through September when at 184,689 tons it was higher than at any time since July last year.
The total number of operating rigs in the US and Canada on November 11th was 743, up from a low of 445 on May 27th. In that time frame the oil rig count was up from 330 to 541 and the gas count was up from 115 to 202. Figure 3 shows the Baker Hughes US Rotary Rig Counts for oil and gas equipment in the US through November 11th (explanation below).
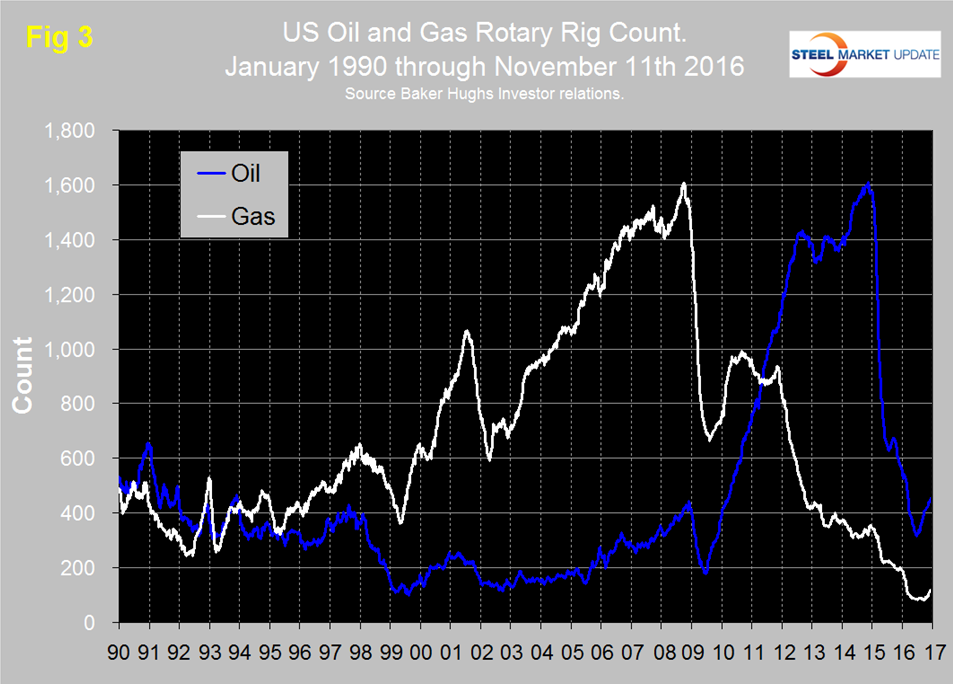
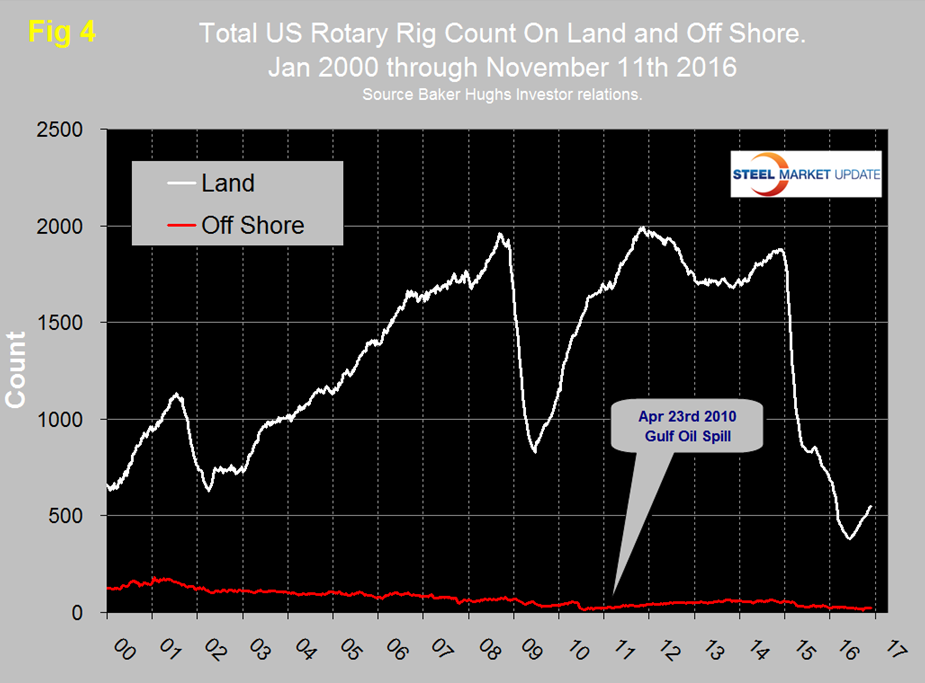
The uptick in the US oil rig count was the first since August of last year and now seems to be well established, having increased from 316 on May 27th to 452 on November 11th. Based on the most recent available data, the EIA estimates that oil production from hydraulically fractured wells now makes up about half of total U.S. crude oil production. The off shore US rig count peaked at 66 on August 29th 2014 immediately before the oil price crash. Since then the off shore count steadily declined to 10 on September 2nd before recovering to 21 on November 11th (Figure 4).
The gas rig count in the US fell rapidly in 2015 and broke through the 200 level on September 11th. After a few months of relative stability the decline continued in late December 2015 and bottomed out at 82 on June 3rd. Since then there has been a small recovery to 115 on November 11th.
On a regional basis in the US, the big three states for operating rigs are Texas, Oklahoma and North Dakota. Texas at 267 on November 11th was up from a low point of 173 on June 20th but still down from 318 at the beginning of the year. Oklahoma at 75 on November 11th was up from its low point of 54 on June 24th but down from 87 at the beginning of the year. North Dakota at 35 on November 11th was up from its low point of 22 on June 3rd but down from 53 at the beginning of the year.
About the Baker Hughes Rotary Rig Count: These are a weekly census of the number of drilling rigs actively exploring for or developing oil or natural gas in the United States. Rigs are considered active from the time they break ground until the time they reach their target depth and may be establishing a new well or sidetracking an existing one. The Baker Hughes Rotary Rig count includes only those rigs that are significant consumers of oilfield services and supplies.


