Market Data

November 10, 2016
Steel Mill Lead Times Jump Out One Week
Written by John Packard
The amount of time it takes a steel mill to produce a product once a new order is placed is measured in weeks. Twice per month Steel Market Update (SMU) conducts a market trends analysis on the flat rolled steel industry. We invite just under 600 steel executives representing about 550 companies to participate in our twice monthly steel survey. Those responding to this weeks questionnaire report lead time averages are surging on virtually all flat rolled steel products.
The SMU lead times referenced in this article should not be confused with the lead time sheets and quotes that come directly out of the individual steel mills. Our respondents are providing SMU with an industry average which we can then compare against historical data to see what the trend is and if it differs from last month or last year at this time.
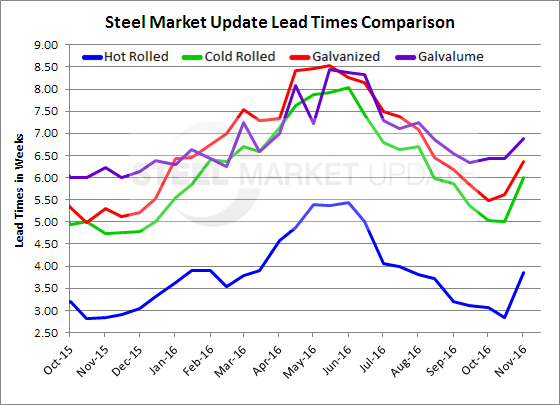
This week hot rolled was measured as averaging 3.86 weeks (almost 4 full weeks) which is one week longer than what was recorded during the middle of October. A one week move on hot rolled during a two week period has to be considered bullish for the steel mills. One year ago HRC lead times were one week shorter at 2.83 weeks.
Cold rolled lead times average 6.0 weeks according to those responding to this week’s survey. This is also one full week better than what we reported during the middle of October. One year ago CR lead times were averaging just under 5.0 weeks (4.74 weeks).
Galvanized lead times also extended but not quite as dramatically as HR and CR shown above. GI lead times now average 6.36 weeks which is three quarters of a week longer than the 5.61 recorded during the middle of October. One year ago lead times for galvanized were averaging one week shorter than what we are reporting today.
Galvalume lead times also increased over the past couple of weeks from 6.43 weeks to 6.88 weeks. One year ago AZ lead times were 6.22 weeks.
Lead times are important to watch as they provide insights into the strength of the steel mill order books which will in turn impact price negotiations. Our graphic below provides a good visual for when the market bottomed and the direction it is suggesting it will go from here.
A side note: The data for both lead times and negotiations comes from only service center and manufacturer respondents. We do not include commentary from the steel mills, trading companies, or toll processors in this particular group of questions.
To see an interactive history of our Steel Mill Negotiations data, visit our website here.


