

Market Data

October 15, 2016
Oil and Gas Prices and Rotary Rig Counts
Written by Peter Wright
The prices of oil and natural gas drive the consumption of oil country tubular goods (OCTG) and related steel products. The energy markets represent a large portion of the hot rolled coil used to make pipe and tube as well as equipment used to drill and pump oil and natural gas.
On October 14th Economy.com had this to say; oil prices surged in the first week of October following OPEC’s announcement in late September that it stands ready to cut output in an effort to boost prices. Following an extraordinary session on September 28, OPEC members agreed on a production target ranging from 32.5 million to 33 million barrels per day. OPEC said it will cut up to 750,000 barrels per day from current output levels to reach that goal. According to Bloomberg estimates, OPEC crude oil output averaged 33.75 mbd in September, up from 33.58 mbd in the previous month and a record high for the 14-member oil cartel. Thus the price of West Texas Intermediate crude topped $50 per barrel in early October for the first time since June. Oil prices got an additional boost on October 10 after Saudi Arabia’s energy minister said $60 per barrel oil was not unthinkable before year’s end. Saudi Arabia remains by far the single most influential oil producer in the market. Any potential OPEC agreement will require Saudi Arabia to make the largest production cut of any OPEC member.
Figure 1 shows historical oil and gas prices since January 2000.
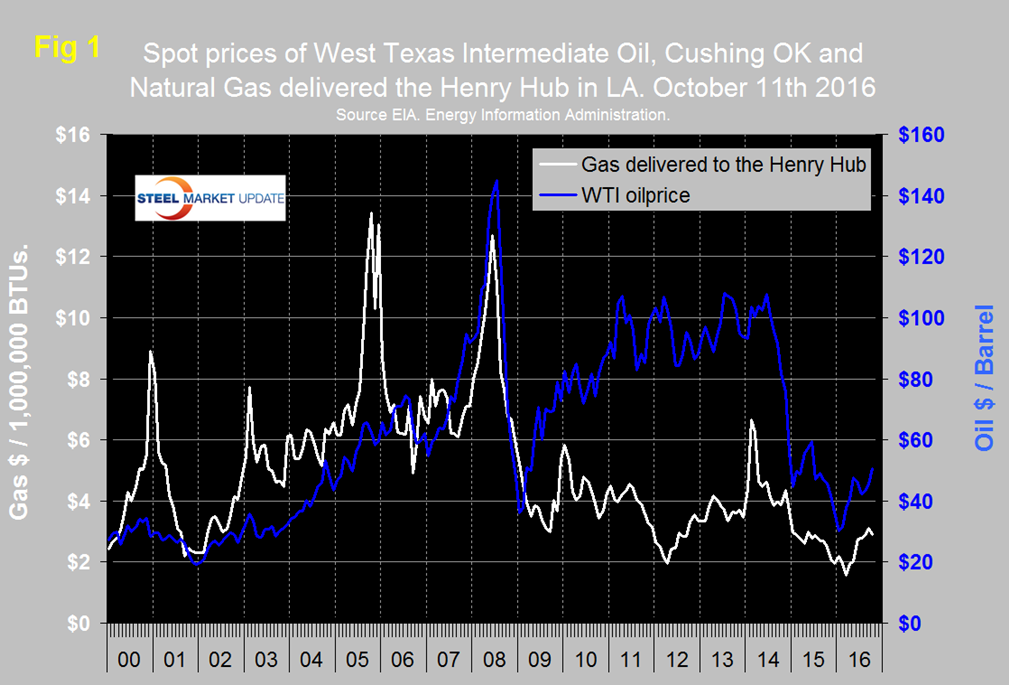
The spot price of West Texas Intermediate (WTI) rose through $40 on April 11th and remained in the $40s except for 3 days in June, the 7th through the 9th when it broke through the $50 level and one day, August 2nd when it dipped to $39.50. On October 5th WTI once again broke through $50 and closed at $50.72 on the 11th according to the Energy Information Administration (EIA). Brent closed at $50.48 on the same day.
The price of natural gas, delivered the Henry Hub in Louisiana closed at $2.91/MM BTU on October 7th, up from $1.57 on March 4th. October 7th was the latest data published by the EIA. The price had trended down for two years prior to March 14th and was below $2.00 in March and April therefore the turnaround since then is encouraging. Natural gas is expected to fuel the largest share of electricity generation in 2016 at 33 percent, compared with 32 percent for coal and in 2017, natural gas and coal are both forecast to fuel 32 percent.
Figure 2 shows the apparent supply of the two main steel tubular products used in oil and gas production from January 2003 through August 2016 (Apparent supply is a proxy for demand.)
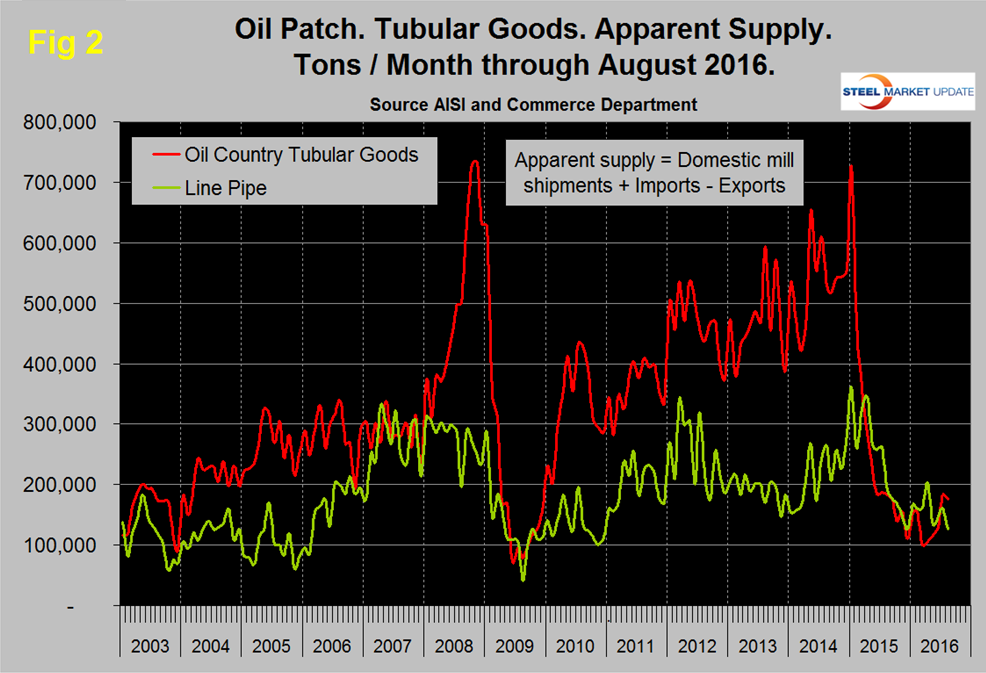
a weak December, line pipe demand coincided with the rising oil price but dived abruptly in May with a further decline in August. The supply of OCTD which had fallen in March to 99,600 tons recovered slightly in April, May and June then shot up to 183,000 tons in July before declining slightly in August.
The total number of operating rigs in the US and Canada on October 7th was 687, up from a low of 445 on May 27th. In that time frame the oil rig count was up from 330 to 515 and the gas count was up from 115 to 172. Figure 3 shows the Baker Hughes US Rotary Rig Counts for oil and gas equipment in the US through October 7th (explanation below).
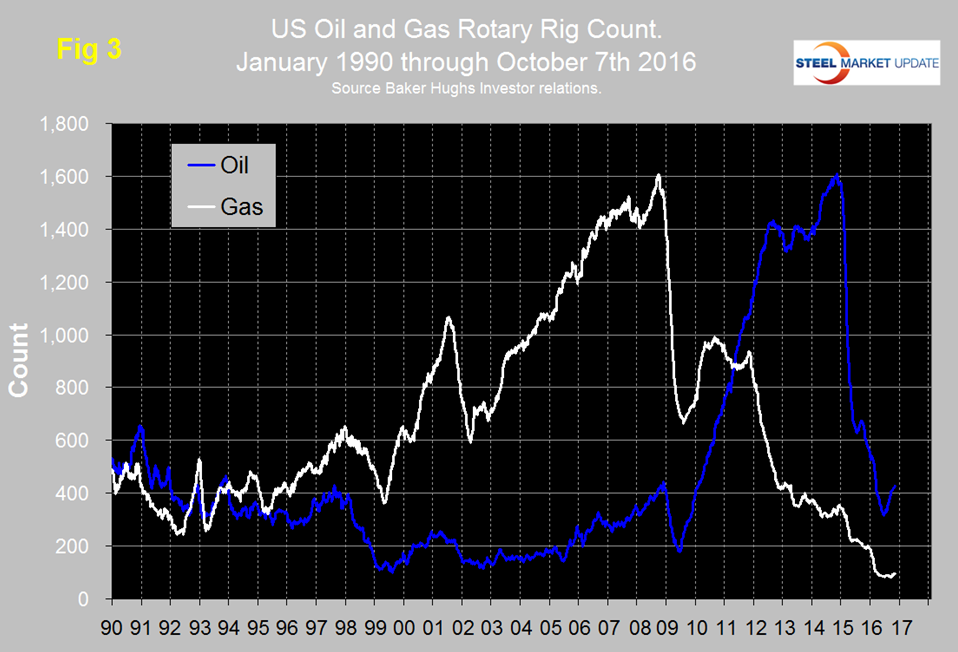
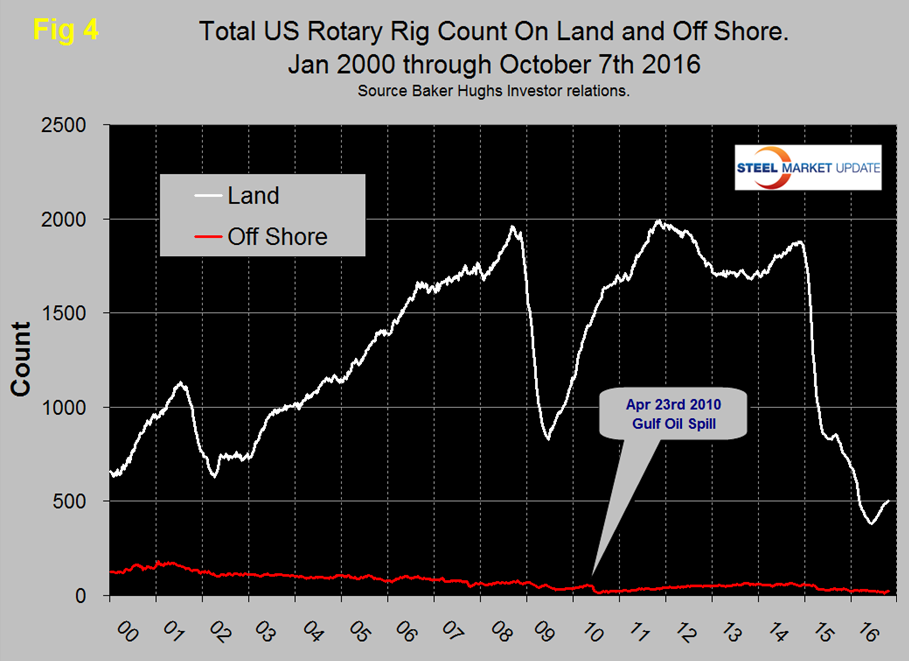
The uptick in the US oil rig count was the first since August of last year and now seems to be well established having increased from 316 on May 27th to 428 on October 7th. Based on the most recent available data, the EIA estimates that oil production from hydraulically fractured wells now makes up about half of total U.S. crude oil production. The off shore US rig count peaked at 66 on August 29th 2014 immediately before the oil price crash. Since then the off shore count steadily declined to 10 on September 2nd before recovering to 23 on October 7th.
The gas rig count in the US fell rapidly in 2015and broke through the 200 level on September 11th. After a few months of relative stability the decline re-commenced in late December 2015 and bottomed out at 82 on June 3rd. Since then there has been a small recovery to 94 on October 7th.
On a regional basis in the US, the big three states for operating rigs are Texas, Oklahoma and North Dakota. Texas at 246 on October 7th was up from a low point of 173 on June 20th but still down from 318 at the beginning of the year. Oklahoma at 70 on October 7th was up from its low point of 54 on June 24th but down from 87 at the beginning of the year. North Dakota at 30 on October 7th was up from its low point of 22 on June 3rd but down from 53 at the beginning of the year.
About the Baker Hughes Rotary Rig Count: These are a weekly census of the number of drilling rigs actively exploring for or developing oil or natural gas in the United States. Rigs are considered active from the time they break ground until the time they reach their target depth and may be establishing a new well or sidetracking an existing one. The Baker Hughes Rotary Rig count includes only those rigs that are significant consumers of oilfield services and supplies.

