Market Data

September 26, 2016
Service Center Apparent Excess/Deficit Analysis & Forecast
Written by John Packard
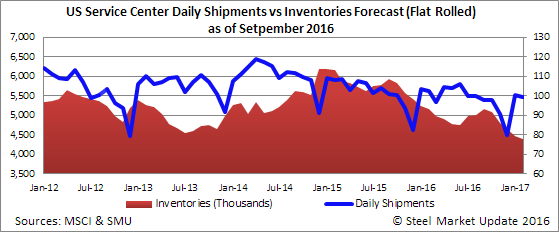
Last month we based our U.S. flat rolled steel service center shipments and inventories on a relatively conservative model. Our belief at that time was both shipments and inventory receipts would be 3 percent below the 3 year average. In actuality shipments were -3.7 percent below year-over-year levels but 7.2 percent below the 3 year average. Carbon flat rolled inventory receipts came in 3.3 percent below year ago levels and 9.0 percent below the 3 year average.
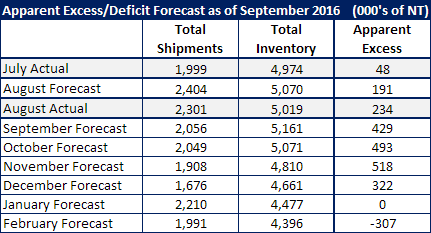
In our model, August shipments would have come in at 2,404,000 tons. Instead the actual number, according to Metal Service Center Institute calculations, was 2,301,000 tons. Shipments did rise from the 1,999,000 tons reported in July but by 103,000 tons less than we had forecast.
Our model called for flat rolled steel inventories to rise from the 4,974,000 tons reported at the end of July to 5,070,000 tons by the end of August. Inventories did indeed rise to 5,019,000 tons which is 51,000 tons less than what we had forecast.
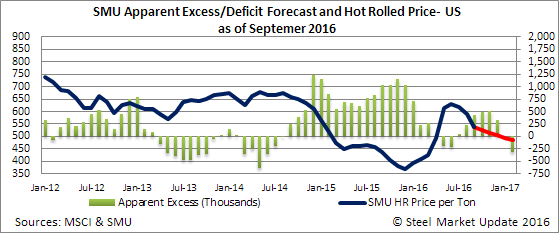
SMU also forecast the flat rolled distributors “Apparent Excess” inventories would increase from +48,000 tons at the end of July to +191,000 tons by the end of August. Again, we got the direction correct but we under estimated the growth by 43,000 tons.
The +234,000 tons of excess inventories is probably one reason why service centers are taking a conservative approach to buying as their needs are either balanced to slightly higher than balanced.
September Forecast
As we look at September the first thing we did is to review what would happen if we continued to use the minus 3 percent for both shipments and receipts in our model over the next few months. What we found is inventories would grow through the end of the year. By the end of December service centers would see inventories balloon to +614,000 tons.
We have decided to look at year-over-year data as being more compelling than using the 3 year average. Since the beginning of this calendar year the average 2016 vs. 2015 is 3.5 percent lower in shipments and 8.3 percent lower in receipts. However, when looking at the May through August time frame receipts were down 0.425 percent.
For the purpose of our new forecast we are going to use shipments at 3 percent below year ago levels and receipts as also being 3 percent below year ago levels.
Shipments during the month of September would come in at 2,055,700 tons and inventories would grow to 5,161,500 tons. The Apparent Excess would grow to +429,000 tons from the current level of +234,000 tons. Here is what the forecast would look like over the next few months based on the 3 percent lower than year ago level forecast for both shipments and receipts.
It is SMU’s opinion that flat rolled prices will continue to drift lower from here (current HRC is $525 per ton). We have it drifting to potentially a low point of $480 per ton. We don’t make a practice of forecasting specific prices or the degree to the change. However, our opinion at this moment is the foreign offers are around $480-$520 per ton level so, unless those numbers drop, we shouldn’t have a wholesale retreat in domestic numbers from here. This may be different with CR and coated steels that have an extra $80 per ton built into the spread between HRC and those products. We expect that spread to be eroded over time.


