

Market Data

August 18, 2016
Lead Times Slip on Cold Rolled and Coated Steels
Written by John Packard
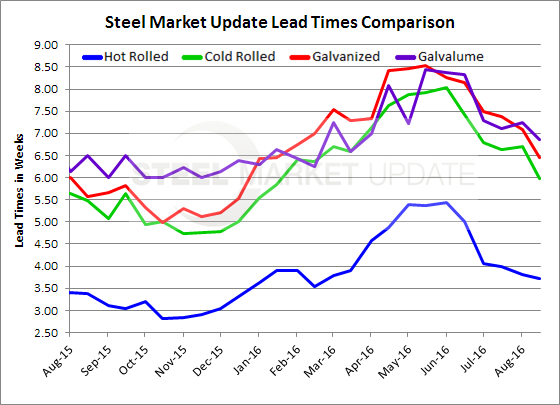
In our last issue of Steel Market Update we wrote about lead times shrinking as being one of the reasons why we adjusted our Price Momentum Indicator. We cited published lead times by NLMK USA and Nucor Berkeley as examples of the changes we were seeing and discussing with steel buyers. This week we conducted our flat rolled steel market trends analysis and as part of that process we asked for information about lead times. Based on the average of all of the data points received we found hot rolled lead times remained the same as what we saw at the beginning of the month while cold rolled, galvanized and Galvalume lead times were shorter.
Hot rolled lead times are averaging just under 4.0 weeks (3.73 weeks) according to our survey participants. This is in line with the 3.80 weeks reported at the beginning of August. This is also about a half a week longer than what we saw at this point in time last year when our survey found the average HRC lead time to be 3.38 weeks.
Cold rolled lead times are now averaging 6 weeks (5.97 weeks) down from about 6.75 weeks reported in each of the last three survey periods going back to the beginning of July. Lead times on CRC were 5.48 weeks at this same point in time one year ago.
Galvanized lead times now average 5.45 weeks which is about one half a week less than the 7.08 weeks reported at the beginning of August. During the month of July GI lead times were closer to 7.5 weeks. One year ago GI lead times were essentially the same as what we are reporting for this week (5.48 weeks in 2015 vs. 5.45 weeks now).
Galvalume lead times also shrunk slightly and are now averaging 6.85 weeks, down from 7.25 weeks at the beginning of the month. One year ago AZ lead times averaged 6.50 weeks.
A side note: The data for both lead times and negotiations comes from only service center and manufacturer respondents. We do not include commentary from the steel mills, trading companies, or toll processors in this particular group of questions.
To see an interactive history of our Steel Mill Negotiations data, visit our website here.


