

Market Data

July 24, 2016
Trend Developing as Steel Mill Lead Times Slip
Written by John Packard
We pointed out a couple of weeks back that lead times have been slowly shrinking but are still longer than year ago levels. Lead times refer to the amount of time it takes to get an order placed today produced at one of the domestic steel mills.
The steel mill lead times we are discussing in this article are based on the cumulative average based on responses collected from all of the manufacturers and service centers who participated in our flat rolled steel trends analysis (survey) this past week. For specific mill lead times, buyers should contact their steel mill representative or rely upon the lead time sheets produced by your steel suppliers.
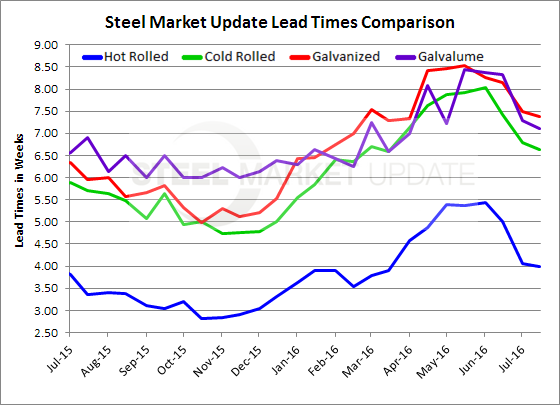
Hot rolled lead times are averaging 4.0 weeks, essentially unchanged from our early July analysis (4.07 weeks). At the beginning of June HRC lead times peaked at 5.43 weeks. One year ago HRC lead times were 3.37 weeks.
Cold rolled lead times also were essentially unchanged at 6.63 weeks versus the 6.79 weeks measured at the beginning of July. As with hot rolled, cold rolled lead times peaked the first week of June at 8.04 weeks. One year ago CRC lead times were reported to be averaging less than 6.0 weeks (5.71 weeks).
Galvanized lead times slipped slightly to 7.38 weeks from 7.50 weeks. The peak for GI lead times was during the month of May when they were averaging 8.5 weeks. They have been slowly slipping ever since. One year ago lead times were about 6.0 weeks (5.95 weeks).
Galvalume lead times also slipped a tiny bit from 7.29 weeks at the beginning of the month to 7.11 weeks. The peak of the cycle was achieved during the middle of May at 8.44 weeks.
Lead times are one of the best indicators as we strive to understand the strength of the market and what direction prices are most likely to move from here. At this time, Steel Market Update has our Price Momentum Indicator at Neutral suggesting momentum for prices is not clearly defined and that they could move in either direction (+/- $20/ton) over the next 30 days.
A side note: The data for both lead times and negotiations comes from only service center and manufacturer respondents. We do not include commentary from the steel mills, trading companies, or toll processors in this particular group of questions.
To see an interactive history of our Steel Mill Negotiations data, visit our website here.


