Market Data

July 17, 2016
Industrial Production and Manufacturing Capacity Utilization in June 2016
Written by Peter Wright
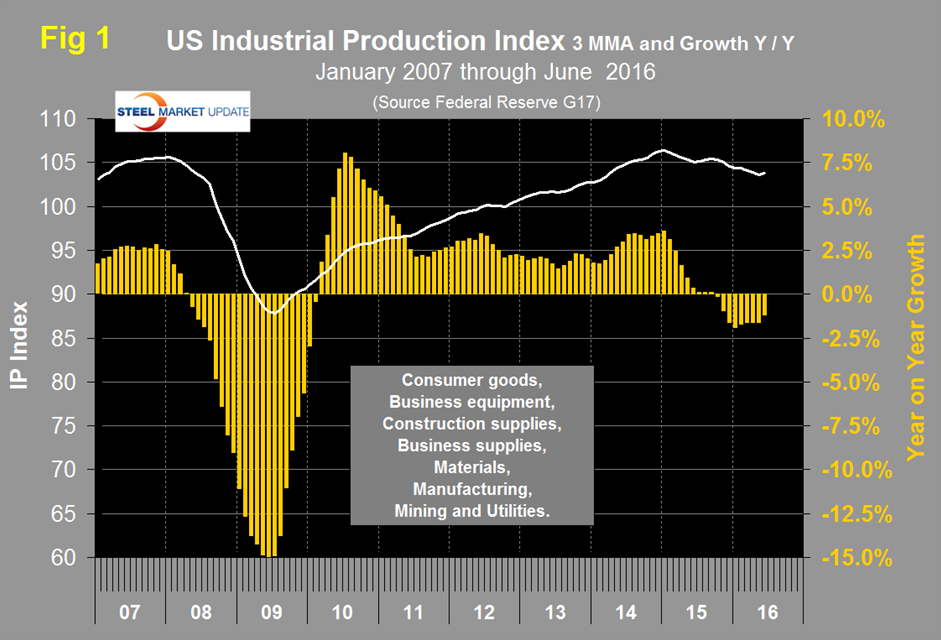
Both these data points are reported in the Federal Reserve G17 data base. The index had an all-time high of 106.70 in November 2014 and has trended down ever since. The good news is that the three month moving average (3MMA) had positive growth month/month in June for the first time since September last year. In June M/M growth on a three month moving average basis, was positive 0.6 percent but the 3MMA growth on a Y/Y basis was negative 1.2 percent.
This means that momentum is positive since there was a short term (3 months) improvement compared to the longer term (12 months) decline. We place less emphasis on the actual numbers than we do direction and we conclude that the June data suggests an improvement in industrial production. Momentum has been positive for 11 straight months. Figure 1 shows the 3MMA of the index and the Y/Y growth. On this Y/Y basis the negativity is decreasing. Data is seasonally adjusted and the index is based on the May 2012 level being defined as 100.
The July federal reserve beige Book was released on Wednesday last week and had this to say: Manufacturing activity was mixed since the previous report. The reporting Districts noted that the outlook remained positive but deteriorated. Activity declined in Richmond and Dallas, remained unchanged in Cleveland and San Francisco, and increased in Boston and Atlanta, but at a slower pace than previously reported. Activity continued to increase at a modest pace in Chicago and Minneapolis. Several Districts reported a rebound following a decline in the previous reporting period, including New York, Philadelphia, St. Louis, and Kansas City. Several Districts reported strength in aircraft and automobile manufacturing, although contacts in Cleveland noted that year-to-date production of automobiles is lower than at this time last year. Conditions in the primary metals industry were mixed: Contacts in Philadelphia and Dallas reported declines in new orders and weaker activity, while contacts in Cleveland and Chicago reported an increase in demand for steel. In Boston, Chicago, and Minneapolis, manufacturers with ties to the energy sector reported weakness.
Manufacturing capacity utilization was 75.07 percent in June with a 3MMA of 74.98 percent (Figure 2).
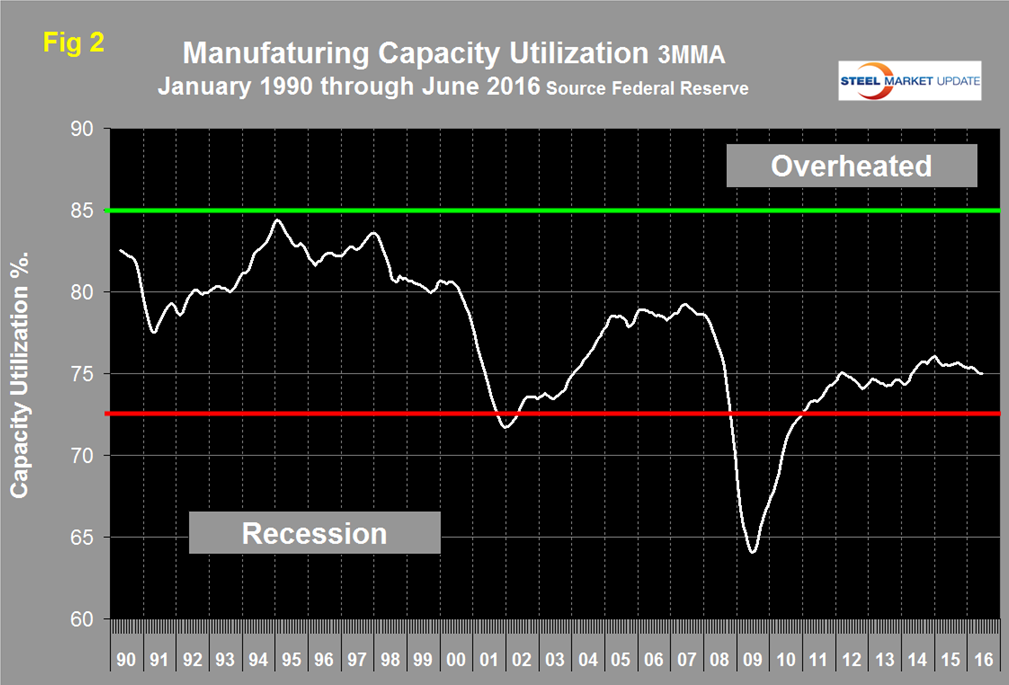
In January last year, utilization exceeded 76 percent for the first time since the recession and has been slowly declining ever since. Regarding the June result the Fed had this to say: “Capacity utilization for manufacturing increased 0.3 percentage point in June to 75.1 percent, a rate that is 3.4 percentage points below its long-run average. The operating rate for durables moved up 0.6 percentage point to 76.1 percent, while the rates for nondurables and other manufacturing (publishing and logging) fell to 74.8 percent and 62.5 percent, respectively. The operating rate for mining moved up 0.4 percentage point to 73.6 percent, and the rate for utilities jumped nearly 2 percentage points to 79.3 percent.”
SMU Comment: Signals about the state of the manufacturing sector have been erratic this year. Manufacturing employment growth was dismal in February and March and in the first six months of 2016 lost 26,000 jobs through June had a positive gain of 14,000. This IP report suggests positive growth in the short term with positive momentum. In March this year the ISM manufacturing index signaled positive growth by exceeding 50 for the first time since August last year. In June the index stood at 53.2, its highest level since January 2015. The 3MMA of the ISM index became positive in April for the first time since last October (Figure 3).
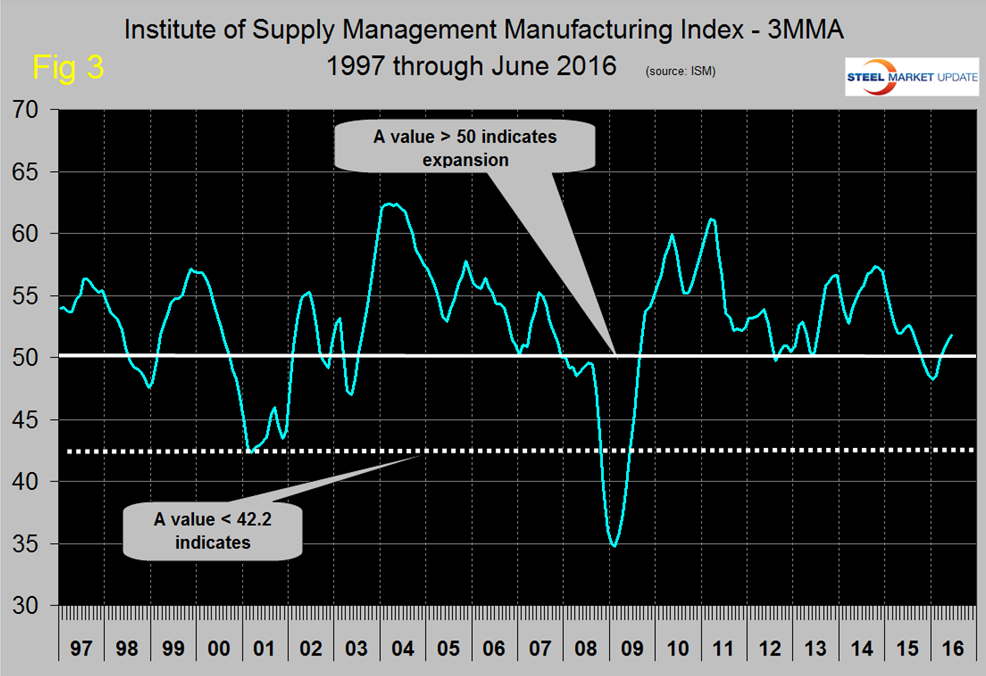
We regard the ISM index as “leading” therefore combined with positive momentum in the IP index our expectations for manufacturing in the short term are positive. At SMU we try to examine two or three measures of the same activity as a reality check and on this basis manufacturing is flashing positive. Stay tuned!