Market Data

May 27, 2016
Industrial Production and Manufacturing Capacity Utilization through April 2016
Written by John Packard
Both of these data points are reported in the Federal Reserve G17 data base. The index had an all-time high of 106.40 in January 2015 and has had a mixed performance ever since. In 2016 month over month growth has been positive for two months and negative for two month. In April M/M growth on a three month moving average basis (3MMA) was positive 0.7 percent but the 3MMA growth on a Y/Y basis was negative 1.5 percent. So what are we to believe?
This could and will be spun both ways. Our preference is to say that the short term result indicates positive growth but more importantly the data suggests that momentum is positive because the short term result (1 month) is better than the long term result (12 months). We place less emphasis on the actual numbers than we do direction and we conclude that the April data suggests an improvement in industrial production. Figure 1 shows negative Y/Y growth of the 3MMA but the negativity is decreasing. Data is seasonally adjusted and the index is based on the May 2012 level being defined as 100.
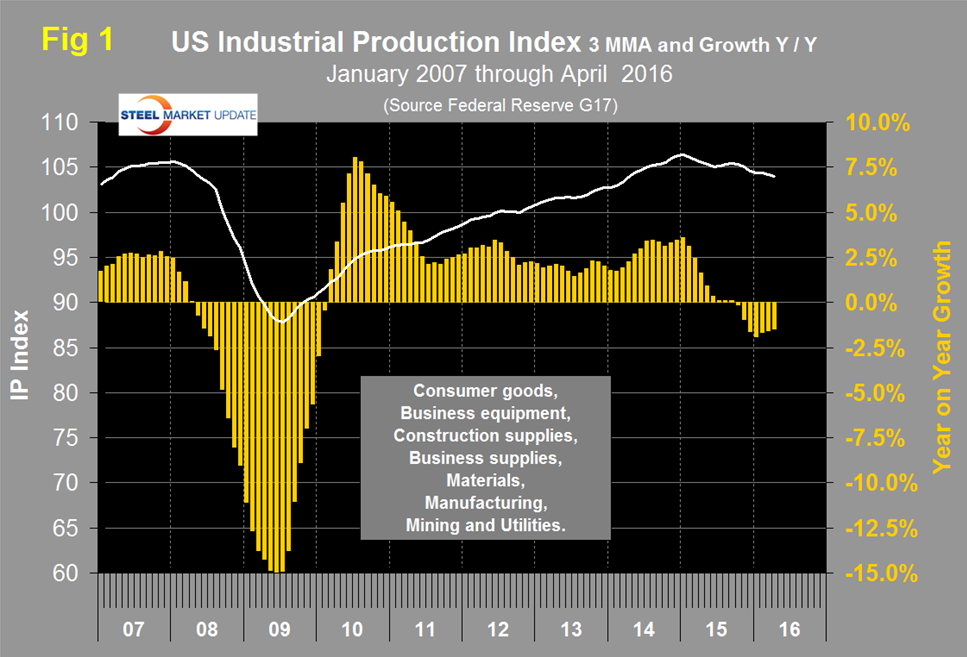
The official report read as follows; Industrial production increased 0.7 percent in April after decreasing in the previous two months. Manufacturing output rose 0.3 percent after declining the same amount in March. The index for utilities jumped 5.8 percent in April, as the demand for electricity and natural gas returned to a more normal level after being suppressed by warmer-than-usual weather in March. Mining production fell 2.3 percent in April, and it has decreased more than 1 1/2 percent per month, on average, over the past eight months. At 104.1 percent of its 2012 average, total industrial production in April was 1.1 percent below its year-earlier level.
Manufacturing capacity utilization was 75.29 percent in April with a 3MMA of 75.26 percent (Figure 2).
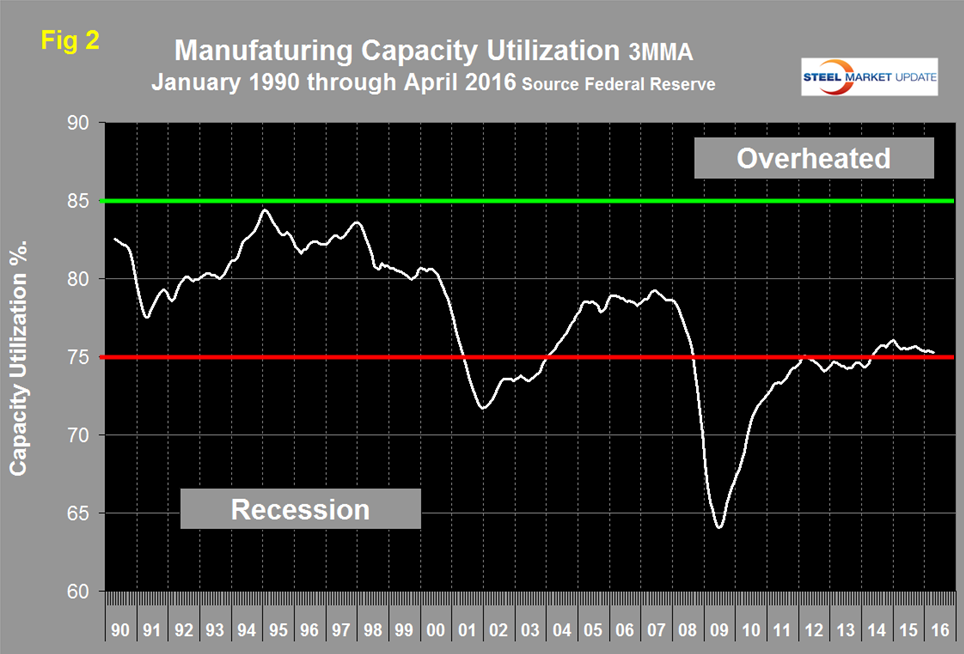
In January last year, utilization exceeded 76 percent for the first time since the recession and has been slowly declining ever since. Regarding the April result the Fed had this to say; “Capacity utilization for the industrial sector increased 0.5 percentage point in April to 75.4 percent, a rate that is 4.6 percentage points below its long-run (1972–2015) average.”
SMU Comment: Signals about the state of the manufacturing sector have been erratic this year. Manufacturing employment growth was dismal in February and March but returned to positive territory in April. This IP report suggests positive growth in the short term with positive momentum. The ISM manufacturing index surged in March to 51.8, its highest level since July last year then declined in April to 50.8 percent. The 3MMA of the ISM index became positive in April for the first time since last October (Figure 3).
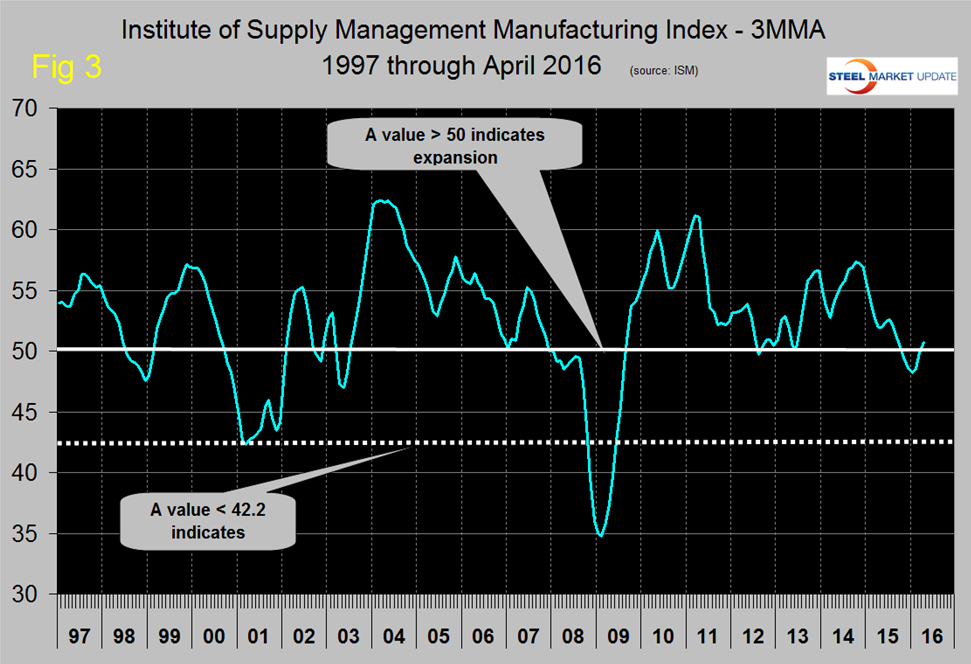
Any value >50 indicates expansion. At SMU we try to examine two or three measures of the same activity as a reality check and on this basis manufacturing is flashing positive in April. Stay tuned!