

Market Data

April 18, 2016
Regional Job Creation for First Quarter 2016
Written by John Packard
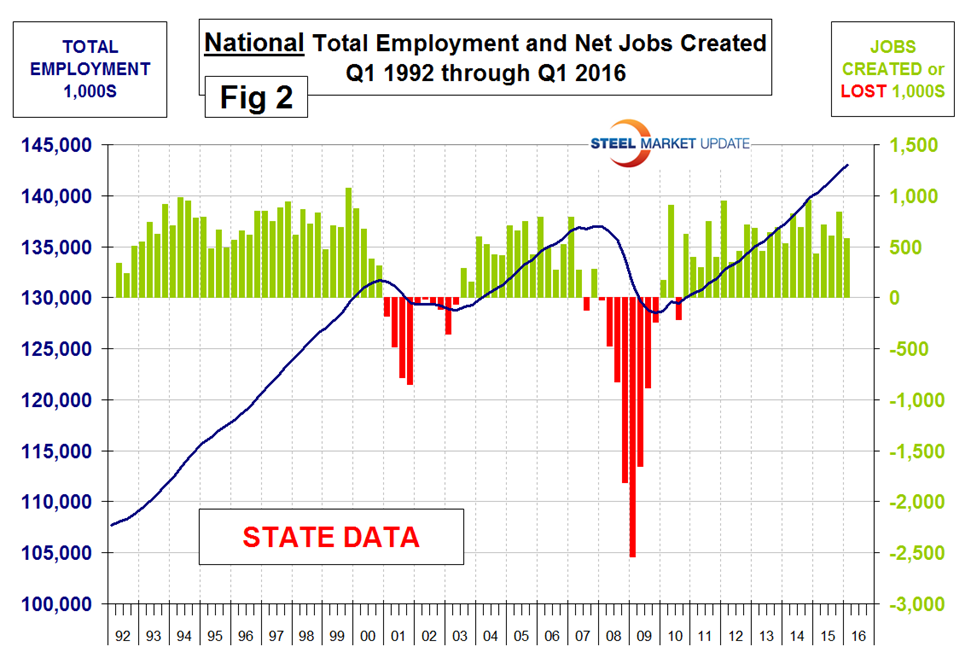
The states compile their employment numbers independently of the Feds, then both are reported by the Bureau of Labor Statistics. The results are close. In the last thirteen quarters since Q1 2013, the Feds reported total job creation of 8,948,000 and the states reported 8,610,400. There is a difference in these reports that shrinks the small discrepancy. The Feds capture off shore military personnel but the states don’t. Figures 1 and 2 show the history of Federal and State totals since 1992. SMU has graphs in the same format for 10 geographic regions and can produce for individual states if a reader so requests.

The 10 geographic regions described in this report are described as follows;
New England, (CT, ME, MA, NH, RI, VT)
North East, (NY, PA, NJ)
Mid Atlantic, (DE, DC, MD, NC, SC, VA, WV)
North Central, (IA, KS, MN, MO, NE, ND and SD)
East North Central (IL, IN, MI, OH and WI)
East South Central, (AL, KY, MS and TN)
South Central, (TX, OK, LA and AR)
Mountain, (AZ, CO, ID, MT, NV, NM. UT, WY)
Pacific region, (CA, OR and WA)
South East, (FL, GA)
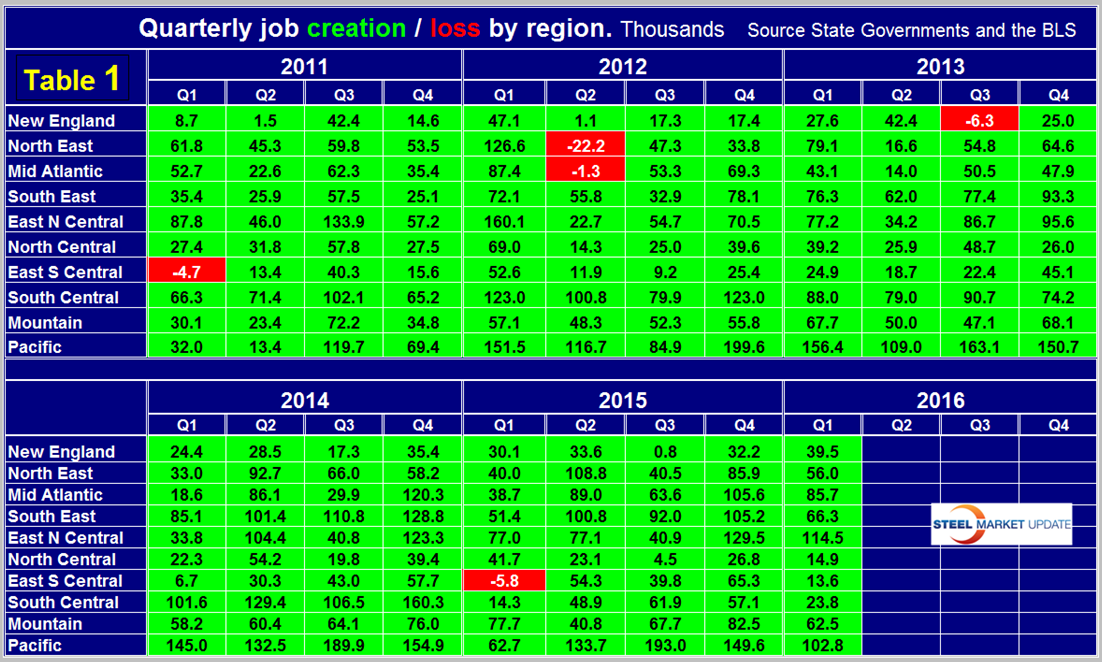
Table 1 shows the history of quarterly job creation by region for the last 5 years. All regions had positive job creation in each of the last four quarters. Problems in the oil and gas industries are evident in these regional employment reports. The South Central region went off a cliff in Q1 2015 after having the highest job creation of any region in the previous quarter. This region rebounded in Q2 through Q4 2015 but is nowhere near where it was before the oil price collapse. In the five quarters since Q4 2014, North Dakota has lost 20,700 jobs, Oklahoma has lost 6,100 jobs but Texas has gained 185,000 jobs. The East North Central region created the most jobs in Q1 of this year followed by the Pacific region. The only region to have had a losing quarter in the last five was the East South Central in Q1 2015.
The regions have fared very differently since the pre-recession high of 1st Q 2008 and since the low point of 4th Q 2009. There are now 5,976,000 more people employed than there were immediately before the recession but of that number almost half occurred in the South Central, and Pacific regions, (Table 2).
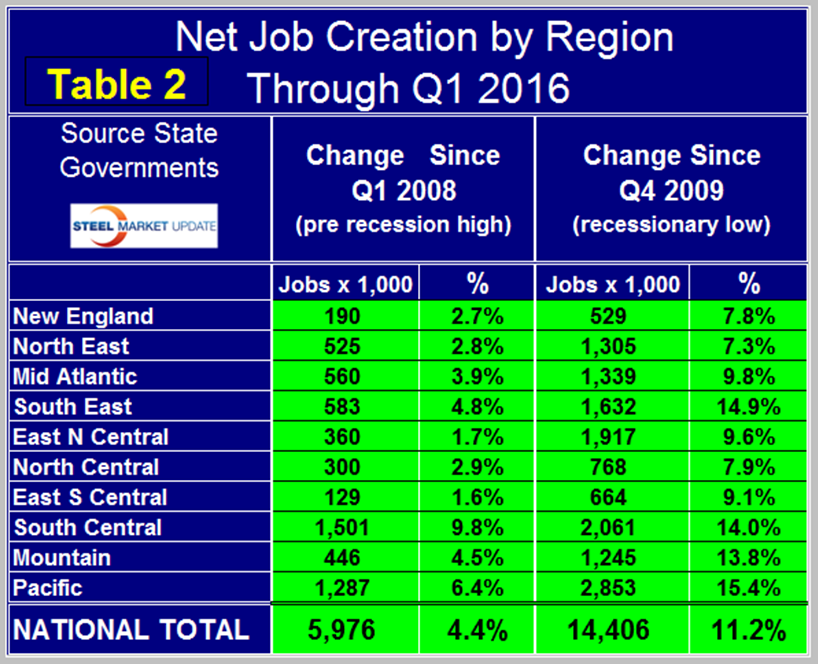
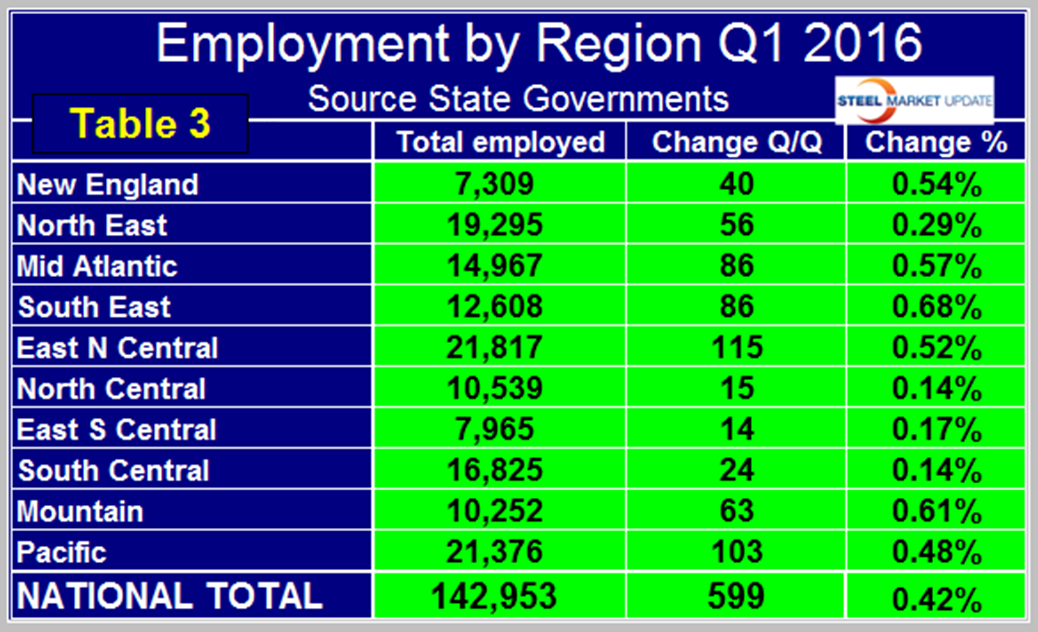
The 3rd Q of 2015 was the first time that every region had more people employed than it did at the pre-recession peak. Employment is now 14,406,000 positions higher than it was at the low point of the recession. The Pacific has had the largest number of jobs created during the recovery with an increase of 2,853,000 positions which amounts to 15.4% of total employment. The South Central is in 2nd place with 2,061,000 jobs created which is 14.0% of total employment. The East North Central currently has the highest number of employed people with 21,817,000, closely followed by the Pacific with 21,376,000, (Table 3). During the depths of the recession in Q1 and Q2 2009, the East North Central had the highest number of job losses.
SMU comment; we believe it’s important for those subscribers whose businesses are substantially regional to have as much data as possible to compare their own results with those of their locality. This report along with the regional GDP report that we initiated last month is intended to help in that respect.


