Market Data

April 14, 2016
Global Economic Outlook: IMF April 2016
Written by Peter Wright
We have include an abridged statement from the IMF that was released on Tuesday this week and in which the commodity situation continues to loom large. Our SMU data analysis follows with comments about the future of global and domestic steel demand through 2021. We believe that an understanding of global influences is essential if we are to have any idea what the future of the US steel market will look like. After the Federal Reserve published its minutes last week, New York Federal Reserve president William Dudley stated that the Fed must approach future rate hikes with caution. Dudley reiterated Fed chair Yellen’s recent comments that although domestic growth was steady, the US economy remained prone to risks due to turbulent conditions in the global economy.
![]() Transcript of the World Economic Outlook Press Conference
Transcript of the World Economic Outlook Press Conference
The baseline projection for global growth in 2016 is a modest 3.2 percent, broadly in line with last year’s World Economic Outlook (WEO) update. The recovery is projected to strengthen in 2017 and beyond, driven primarily by emerging market and developing economies, as conditions in stressed economies start gradually to normalize. But uncertainty has increased, and risks of weaker growth scenarios are becoming more tangible. The fragile conjuncture increases the urgency of a broad-based policy response to raise growth and manage vulnerabilities. The global recovery has weakened further amid increasing financial turbulence. Activity softened toward the end of 2015 in advanced economies, and stresses in several large emerging market economies showed no signs of abating. Adding to these headwinds are concerns about the global impact of the unwinding of prior excesses in China’s economy as it transitions to a more balanced growth path after a decade of strong credit and investment growth, along with signs of distress in other large emerging markets, including from falling commodity prices.
With heightened risk aversion and increasing concerns about the lack of policy space, the valuation of risky assets as well as oil prices dropped sharply in early 2016. However, market sentiment began to improve in mid-February, and by the end of March market valuations had recovered most of or all the ground lost earlier in the year.
While growth in emerging market and developing economies still accounts for the lion’s share of projected world growth in 2016, prospects across countries remain uneven and generally weaker than over the past two decades. In particular, a number of large emerging markets—including Brazil and Russia— are still mired in deep recessions. Others, including several oil-exporting countries, also face a difficult macroeconomic environment with sharply weaker terms of trade and tighter external financial conditions.
Growth in China and India has been broadly in line with projections, but trade growth has slowed down noticeably. The trade slowdown is related to the decline in investment growth across emerging market economies, which reflects rebalancing in China but also the sharp scaling down of investment in commodity exporters, particularly those facing difficult macroeconomic conditions.
Growth in advanced economies is projected to remain modest, in line with 2015 outcomes. Unfavorable demographic trends, low productivity growth, and legacies from the global financial crisis continue to hamper a more robust pickup in activity. While very accommodative monetary policy and lower oil prices will support domestic demand, still-weak external demand, further exchange rate appreciation—especially in the United States—and somewhat tighter financial conditions will weigh on the recovery. In the euro area, the risk of a de-anchoring of inflation expectations is a concern amid large debt overhangs in several countries. The projected pickup in growth in 2017 (3.5 percent) and over the rest of the forecast horizon hinges crucially on rising growth in emerging market and developing economies, as growth in advanced economies is expected to remain modest, in line with weakened potential growth. This outcome relies on a number of important assumptions:
• A gradual normalization of conditions in several economies currently under stress
• A successful rebalancing of China’s economy with trend growth rates that—while lower than those of the past two decades—remain high
• A pickup in activity in commodity exporters, albeit at rates more modest than in the past
• Resilient growth in other emerging market and developing economies
SMU Data Analysis
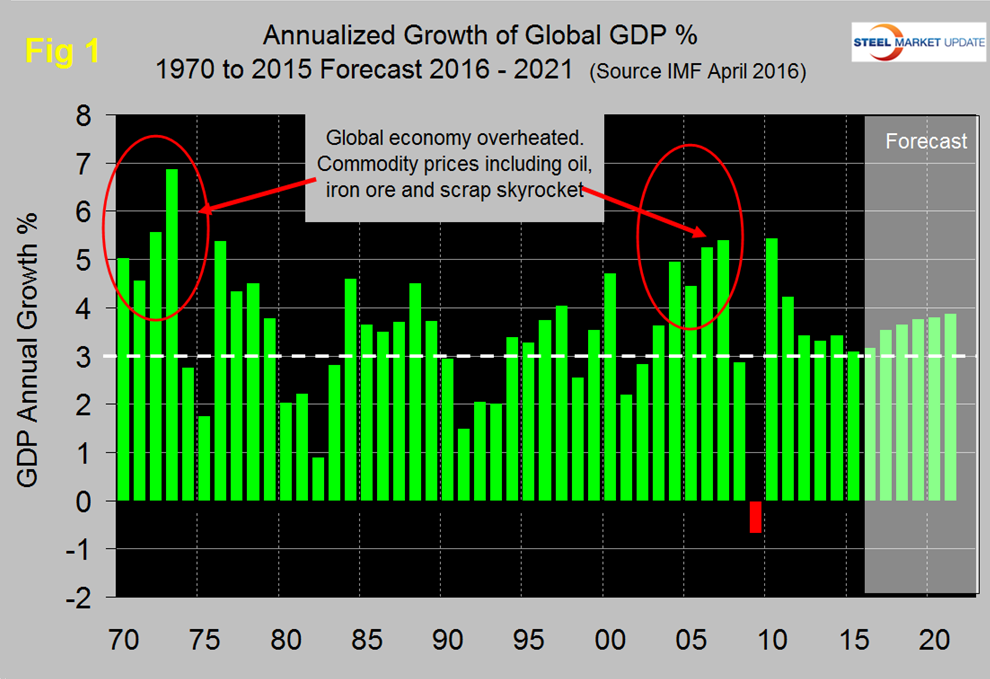
Figure 1 shows the growth of global GDP since 1970 with this month’s IMF forecast through 2021.
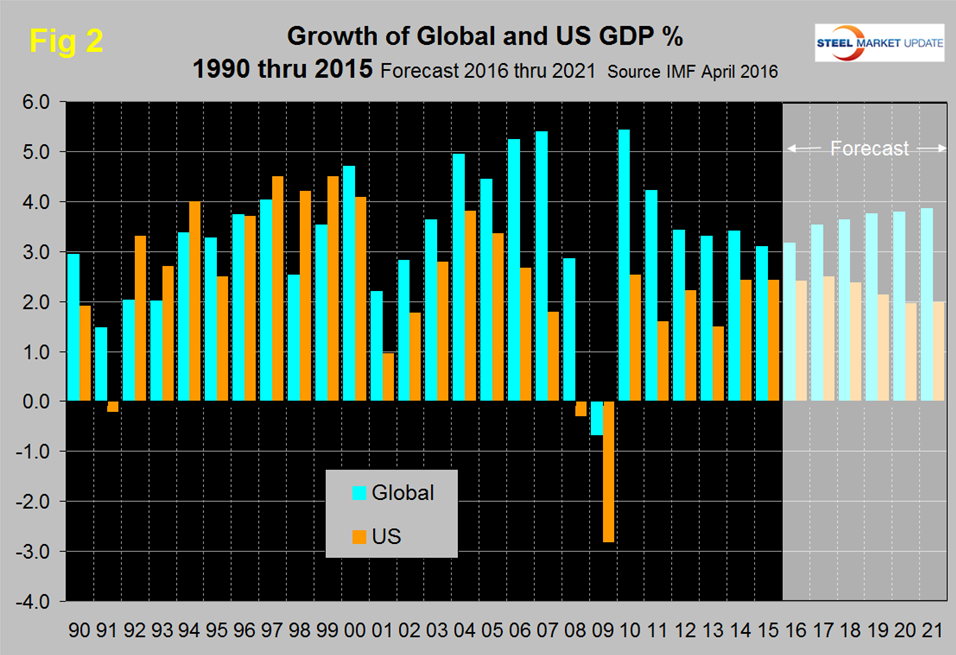
We have highlighted the periods of the early seventies and the mid 2000s when the commodity bubbles prevalent at those times were driven by unusually high and sustained global growth. The collapse of the commodity bubble in the last decade coincided with the US banking and housing crisis setting up the perfect storm. Global growth has been unusually flat in the years 2012 through 2015 followed by a forecasted slow growth through 2021. Prior to the 2001 recession, the US held its own in the economic growth stakes but between 2001 and 2008, growth in the US averaged 1.84 percent less per year than the growth of the global economy as a whole (Figure 2).
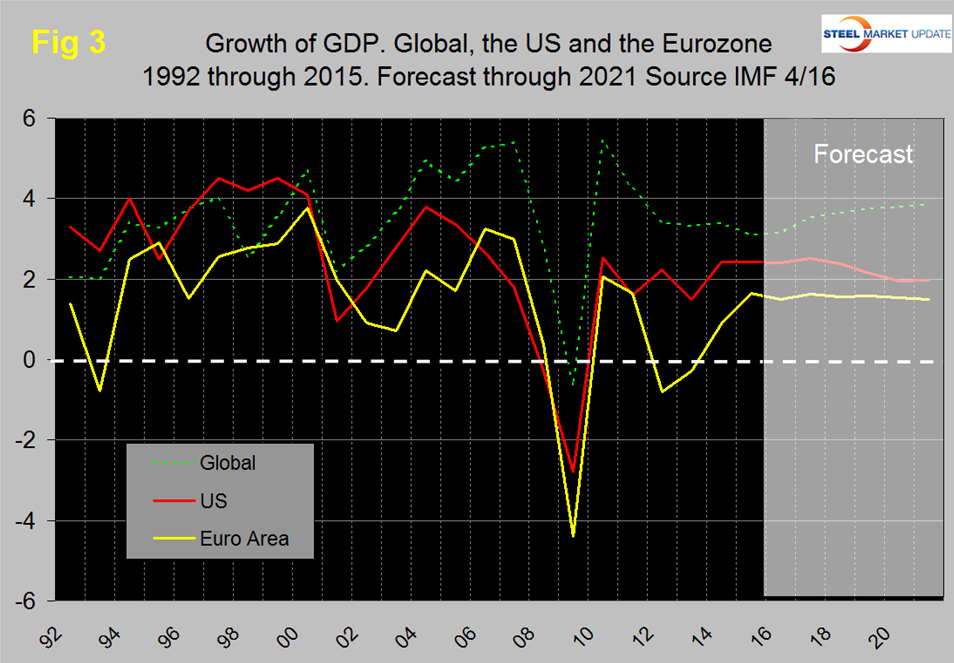
In the years 2011 through 2014 the gap narrowed to 0.98 percent and in 2015 was 0.66 percent. The difference is forecast to widen to 1.88 percent in 2021. Global growth is now projected to gradually climb back to 3.9 percent in 2021, the discrepancy with US widening again. The US has outperformed the Eurozone in every year since 2008 and is forecast to continue to do so through 2021 (Figure 3).
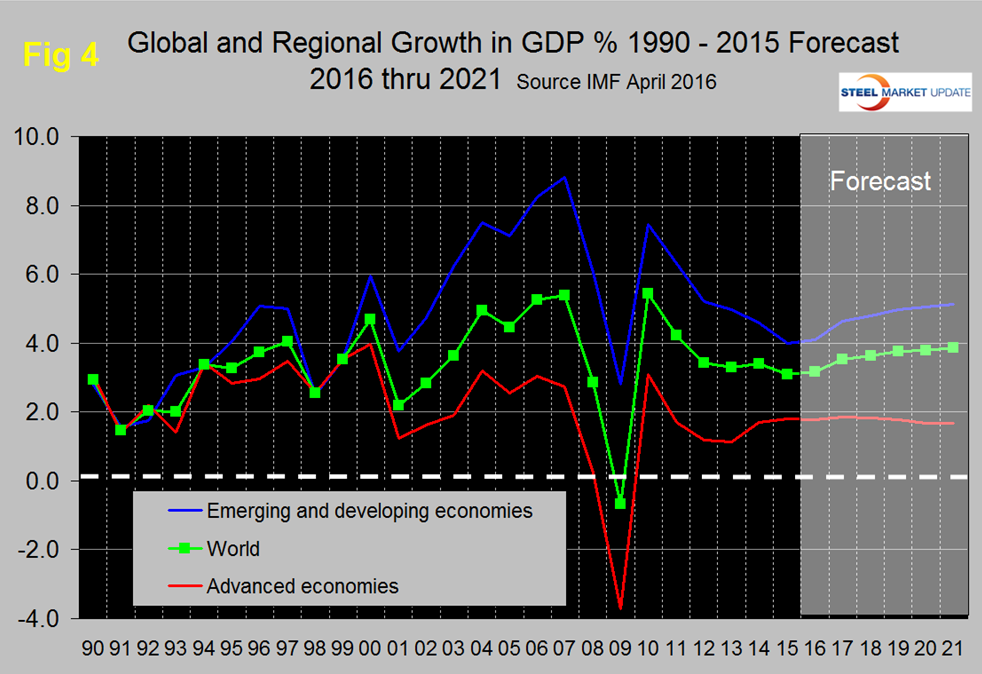
The gap will narrow as we approach the end of this decade. Figure 4 shows the growth comparison between emerging and developing economies and the advanced economies, that gap is projected to widen in the second half of this decade.
Within NAFTA, the growth of GDP of all three nations coincided in 2014. Mexico and the US will track each other through 2017 as Canada lags. Canada and the US are forecasted to converge in 2019 (Figure 5).
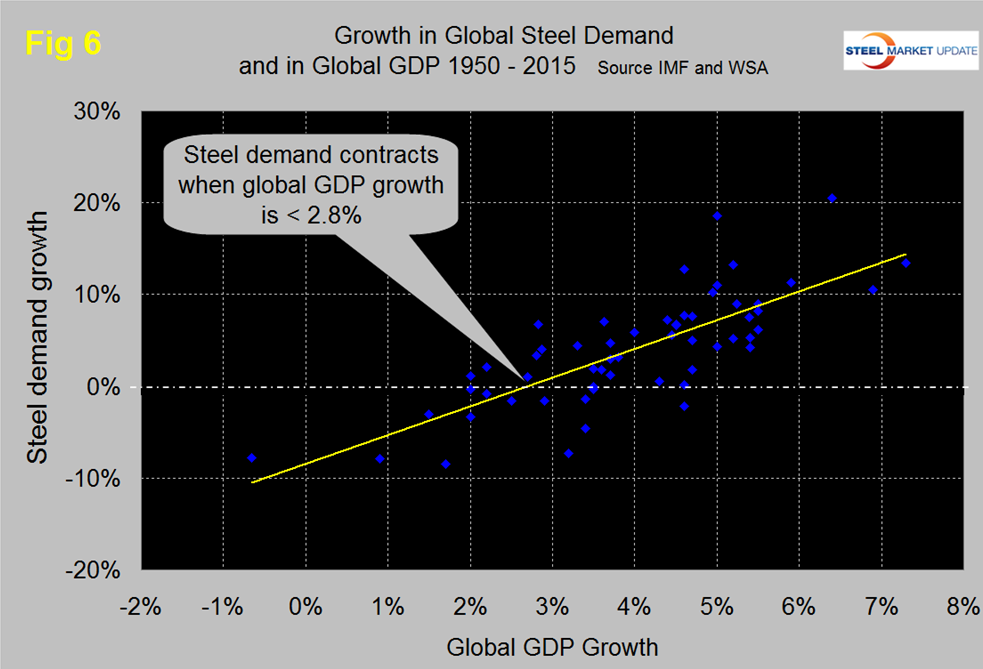
There is a relationship between the growth of GDP and steel demand at both the international and national level which also extends to other commodities such as cement. There are two interesting aspects to this relationship. First the cyclical change in steel demand is vastly more volatile than the change in GDP which we attribute to the inventory response throughout the supply chain. Secondly as discovered by our friends at “Steel Guru” 1 percent growth in GDP does not result in 1 percent growth in steel demand. At the global level it takes a 2.8 percent increase in GDP to get any increase in steel demand (Figure 6).
This is a long term average over a period of 65 years and based on the added volatility of steel can be a predictor of the immediate future. For example after the disastrous decline in steel demand in 2009 there was no doubt that a huge cyclical rebound would occur as inventory managers throughout the world began to react to the economic recovery. If the IMF forecast proves to be correct then the growth in steel demand will improve to around 3 percent by 2017. This is much better than current World Steel Association data through February. Later this month the WSA will release its updated short range forecast for 2016 and 2017. In the US steel market it requires about 2 percent growth in GDP to generate growth in steel demand therefore again if current forecasts prove to be correct regarding the US economy we can expect steel demand to expand through 2018 then tail off as we approach 2021.


