Market Data

March 22, 2016
CFNAI Lower Than Expected in February
Written by Sandy Williams
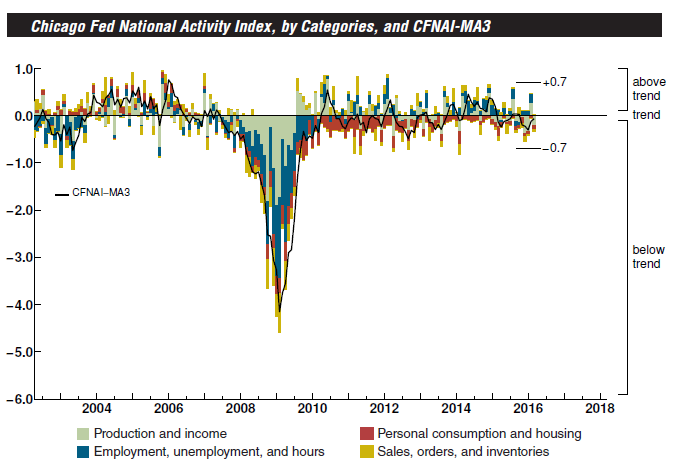
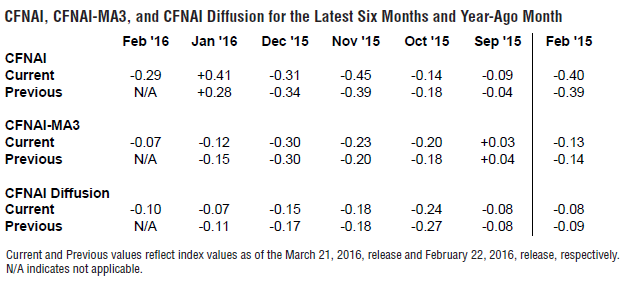
The Chicago Fed National Activity Index dropped lower than expected in February for reading of -0.29 percent from +0.41 percent in January. The reading of -0.29 indicates below average growth for the national economy.
The four main components of the headline index, production and income; employment, unemployment, and hours; personal consumption and housing; and sales, orders, and inventories, all declined to negative percentages in February.
The three month moving average, CFNAI-MA3, inched up to -0.07 from -0.12 suggesting inflationary pressure from economic activity will be subdued over the coming year.
The CFNAI Diffusion Index, also a 3-month moving average, declined to -0.10 from -0.07 in January. The index has 85 individual indicators and only 27 made positive contributions to the CFNAI in February. Of the 85 indicators, 29 improved but 27 were negative, 55 deteriorated, and one was unchanged.
Production related indicators to the CFNAI declined to- 0.21. In the production component, utility and mining output registered declines of 9.3 percent and 9.9 percent, respectively, which offset a 0.2 percent gain in manufacturing output. Sales, orders and inventories contribute -0.03 to the CFNAI, down from-0.02 in January.
A weaker employment index contributed just +0.03 percent to the headline composite.
The contribution to the CFNAI by the personal consumption and housing indicators declined to -0.09 from -0.05 the previous month.
The following from the Federal Reserve Bank of Chicago explains what the Index measures and how it does so.
What is the National Activity Index?
The index is a weighted average of 85 indicators of national economic activity drawn from four broad categories of data: 1) production and income; 2) employment, unemployment, and hours; 3) personal consumption and housing; and 4) sales, orders, and inventories. A zero value for the index indicates that the national economy is expanding at its historical trend rate of growth; negative values indicate below-average growth; and positive values indicate above-average growth.
Why are there three index values?
Each month, we provide a monthly index, its three-month moving average, and a diffusion index. Month-to-month movements can be volatile, so the monthly index’s three-month moving average, the CFNAI-MA3, provides a more consistent picture of national economic growth. The CFNAI Diffusion Index captures the degree to which a change in the monthly index is spread out among its 85 indicators, averaged over a three-month period.
What do the numbers mean?
When the CFNAI-MA3 value moves below –0.70 following a period of economic expansion, there is an increasing likelihood that a recession has begun. Conversely, when the CFNAI-MA3 value moves above –0.70 following a period of economic contraction, there is an increasing likelihood that a recession has ended.
When the CFNAI-MA3 value moves above +0.70 more than two years into an economic expansion, there is an increasing likelihood that a period of sustained increasing inflation has begun.


