Market Data

February 24, 2016
February 2016 Consumer Confidence
Written by Peter Wright
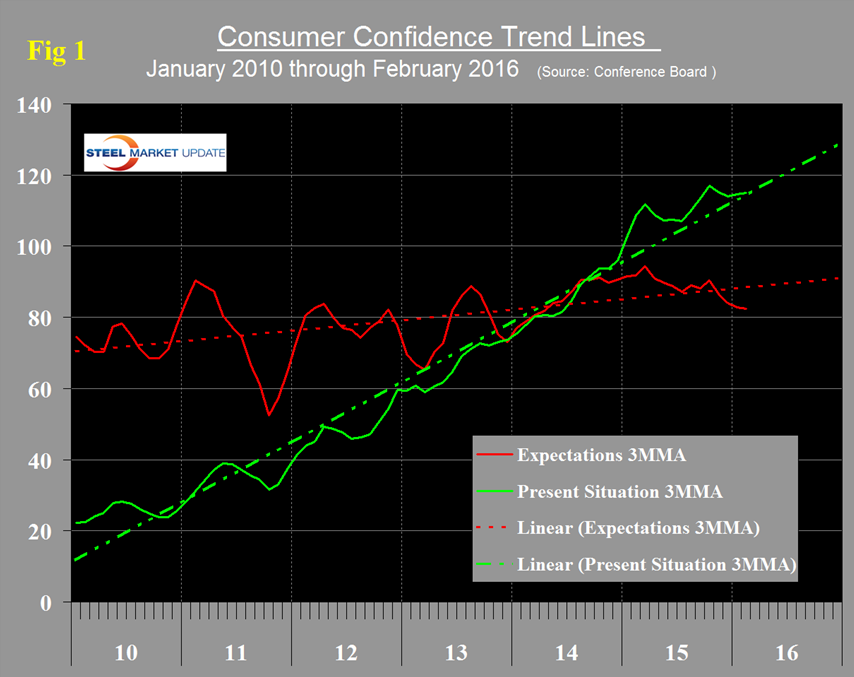
Consumer confidence fell from 97.8 in January to 92.2 in February following improvements in December and January. The three month moving average (3MMA) declined from 95.6 in January to 95.4 in February and therefore obliterated the single month decline which is the way we prefer to look at data such as this which is quite volatile month to month. The 3MMA of the present situation is exactly on its six year trend and that of expectations has been below its six year trend for the last five months (Figure 1).
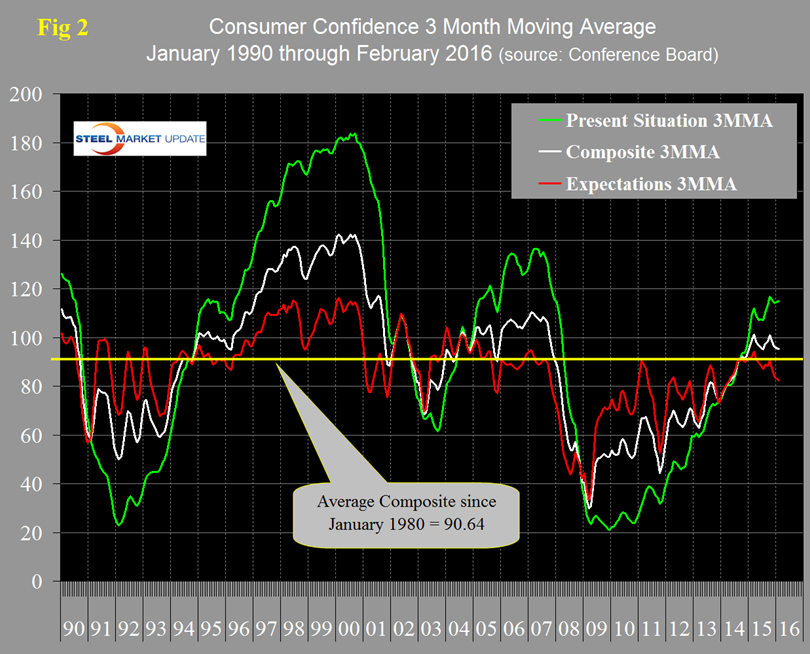
The historical pattern of the 3MMA of the composite, the view of the present situation and expectations are shown in Figure 2.
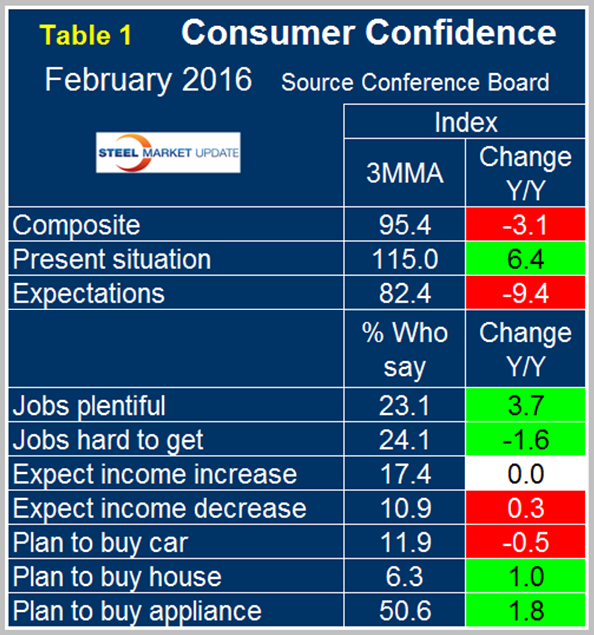
The consistency of the recovery of the composite is looking better than the turn around after the recession in 2003 but has not yet reached the level attained before the great recession. If history repeats itself, the view of the present situation will continue to move ahead and widen the differential between it and expectations. On a year over year basis using a 3MMA, the composite at 95.4 was down by 3.1 which followed the January decrease of 0.3. January was the first time for the y/y 3MMA of the composite to be down since April 2013. On the same basis the view of the present situation was up by 6.4 and expectations were down by 9.4 (Table 1).
We thought that January was basically a status quo report but February appears to show signs of deterioration. The composite consumer confidence index has made no progress in the last 12 months as gains in the present situation component have been countered by declining expectations.
The job availability sub-indexes were both up in February on a 3MMA basis but the expectations for salary increase were unchanged and expectations of a decrease were up. The year over year trend for auto purchase intentions was negative for the seventh straight month. We don’t know what the lead of this component is compared to actual purchases but it doesn’t seem to jive with the exceptional sales result of 2015 as a whole followed by a strong January. Plans to buy a house have been positive for nine straight months and plans to buy an appliance stayed positive after negative reports in November and December. Overall in 2015 through this February 2016 report, the Conference Board index has maintained the strongest value since Q3 2007.
The official news release from the Conference Board reads as follows and is entirely based on monthly changes. This is a highly regarded indicator which we believe needs to be examined in a longer time context to get the real picture.
The Conference Board consumer confidence index declined in February.
The Conference Board Consumer Confidence Index®, which had increased moderately in January, declined in February. The Index now stands at 92.2 (1985=100), down from 97.8 in January. The Present Situation Index declined from 116.6 to 112.1, while the Expectations Index decreased from 85.3 to 78.9 in February.
The monthly Consumer Confidence Survey®, based on a probability-design random sample, is conducted for The Conference Board by Nielsen, a leading global provider of information and analytics around what consumers buy and watch. The cutoff date for the preliminary results was February 11.
“Consumer confidence decreased in February, after posting a modest gain in January,” said Lynn Franco, Director of Economic Indicators at The Conference Board. “Consumers’ assessment of current conditions weakened, primarily due to a less favorable assessment of business conditions. Consumers’ short-term outlook grew more pessimistic, with consumers expressing greater apprehension about business conditions, their personal financial situation, and to a lesser degree, labor market prospects. Continued turmoil in the financial markets may be rattling consumers, but their assessment of current conditions suggests the economy will continue to expand at a moderate pace in the near-term.”
Consumers’ assessment of present-day conditions declined in February. The percentage saying business conditions were “good” decreased from 27.7 percent to 26.0 percent. Those saying business conditions are “bad” increased from 18.8 percent to 19.8 percent. Consumers’ appraisal of the labor market was also less positive. Those claiming jobs are “plentiful” decreased from 23.0 percent to 22.1 percent, while those claiming jobs are “hard to get” rose to 24.2 percent from 23.6 percent.
Consumers were more pessimistic about the short-term outlook than in January. The percentage of consumers expecting business conditions to improve over the next six months declined from 15.9 percent to 14.6 percent, while those expecting business conditions to worsen increased from 10.7 percent to 12.0 percent. Consumers’ outlook for the labor market was less optimistic. Those anticipating more jobs in the months ahead decreased from 13.4 percent to 12.2 percent, while those anticipating fewer jobs increased slightly from 17.0 percent to 17.2 percent. The proportion of consumers expecting their incomes to increase declined from 18.6 percent to 17.2 percent, while the proportion expecting a reduction in income increased from 10.7 percent to 12.5 percent.
About The Conference Board
The Conference Board is a global, independent business membership and research association working in the public interest. Our mission is unique: To provide the world’s leading organizations with the practical knowledge they need to improve their performance and better serve society. The monthly Consumer Confidence Survey®, based on a probability-design random sample, is conducted for The Conference Board by Nielsen, a leading global provider of information and analytics around what consumers buy and watch. The index is based on 1985 = 100. The composite value of consumer confidence combines the view of the present situation and of expectations for the next six months. The Conference Board is a non-advocacy, not-for-profit entity holding 501 (c) (3) tax-exempt status in the United States. www.conference-board.org.
Sources: The Conference Board and SMU Analysis


