Market Data

December 17, 2015
SMU Steel Buyers Sentiment Index: Have We Broken Out to a More Optimistic Industry?
Written by John Packard
The domestic steel mills began raising flat rolled steel prices late last week and into this week. We saw a mild rise in our hot rolled, cold rolled, galvanized and Galvalume indices as the domestic mills began to collect at least a portion of the announced increases. As we canvass the buyers and sellers of steel in our bi-monthly flat rolled market analysis we saw a corresponding mild rise in our two Sentiment Indexes (Current & Future).
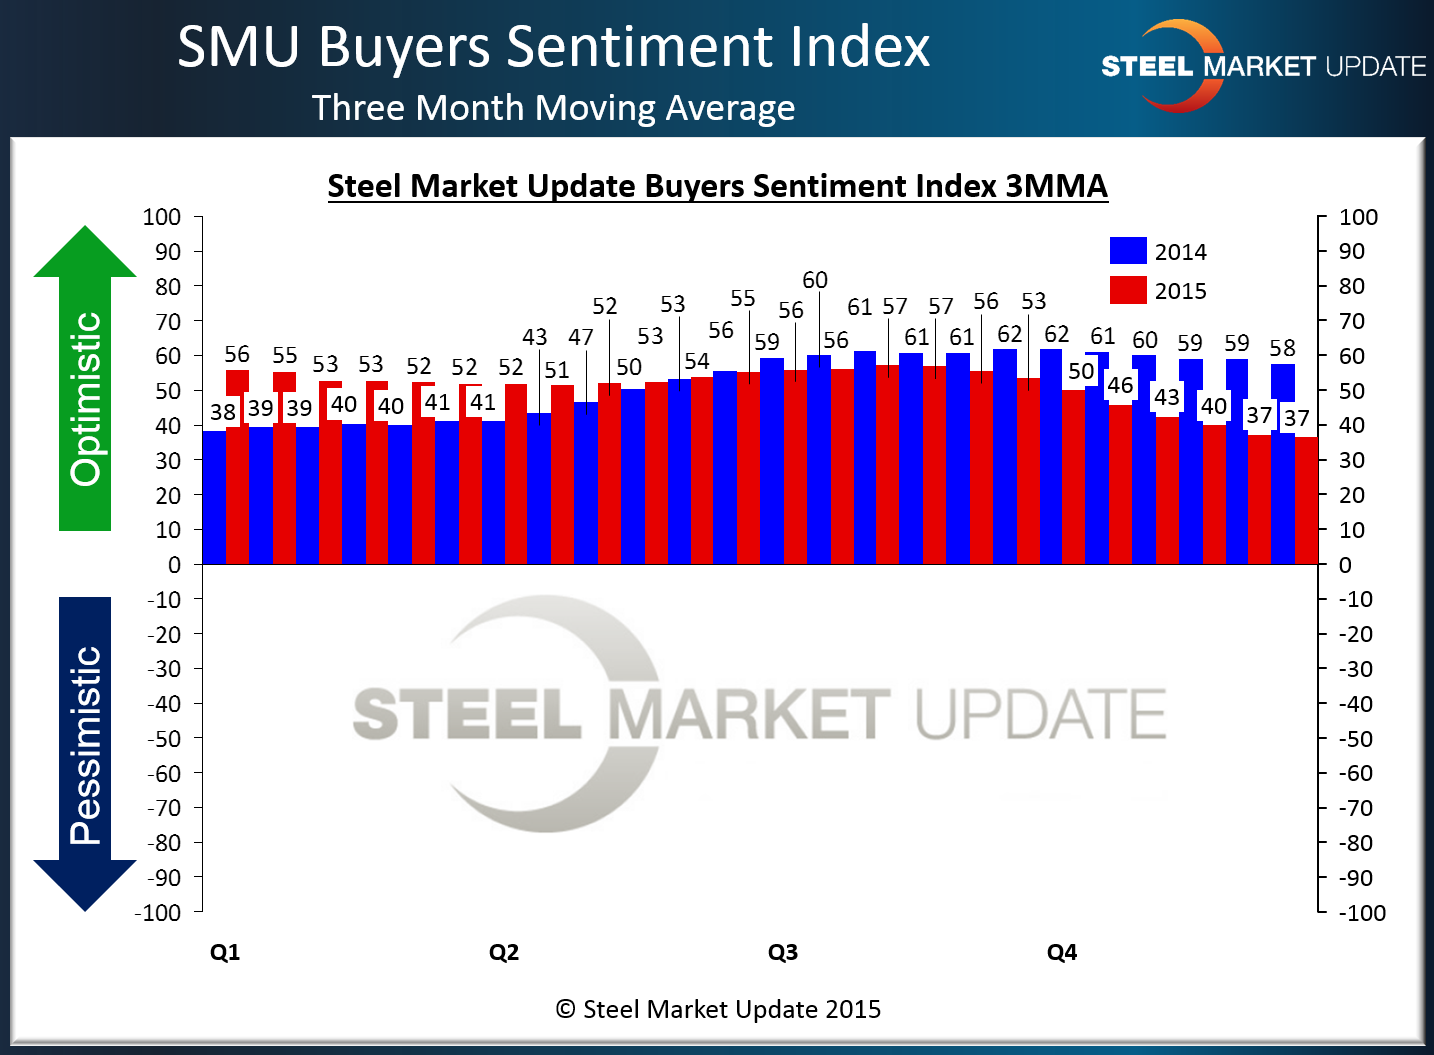
Our Current Steel Buyers Sentiment Index measures how buyers and sellers feel about their company’s ability to be successful in the existing market environment. Current Sentiment is being reported at +43 which is +9 points higher than the beginning of the month and +11 points better than the +32 recorded during the middle of October 2015. However, one year ago Current Sentiment was reported to be +56.
One of the manufacturing respondents to this week’s analysis perhaps put the market Sentiment best when they told us, “We are neither hot or cold on our market. It is ok, but a little slow even accounting for this being the winter months.”
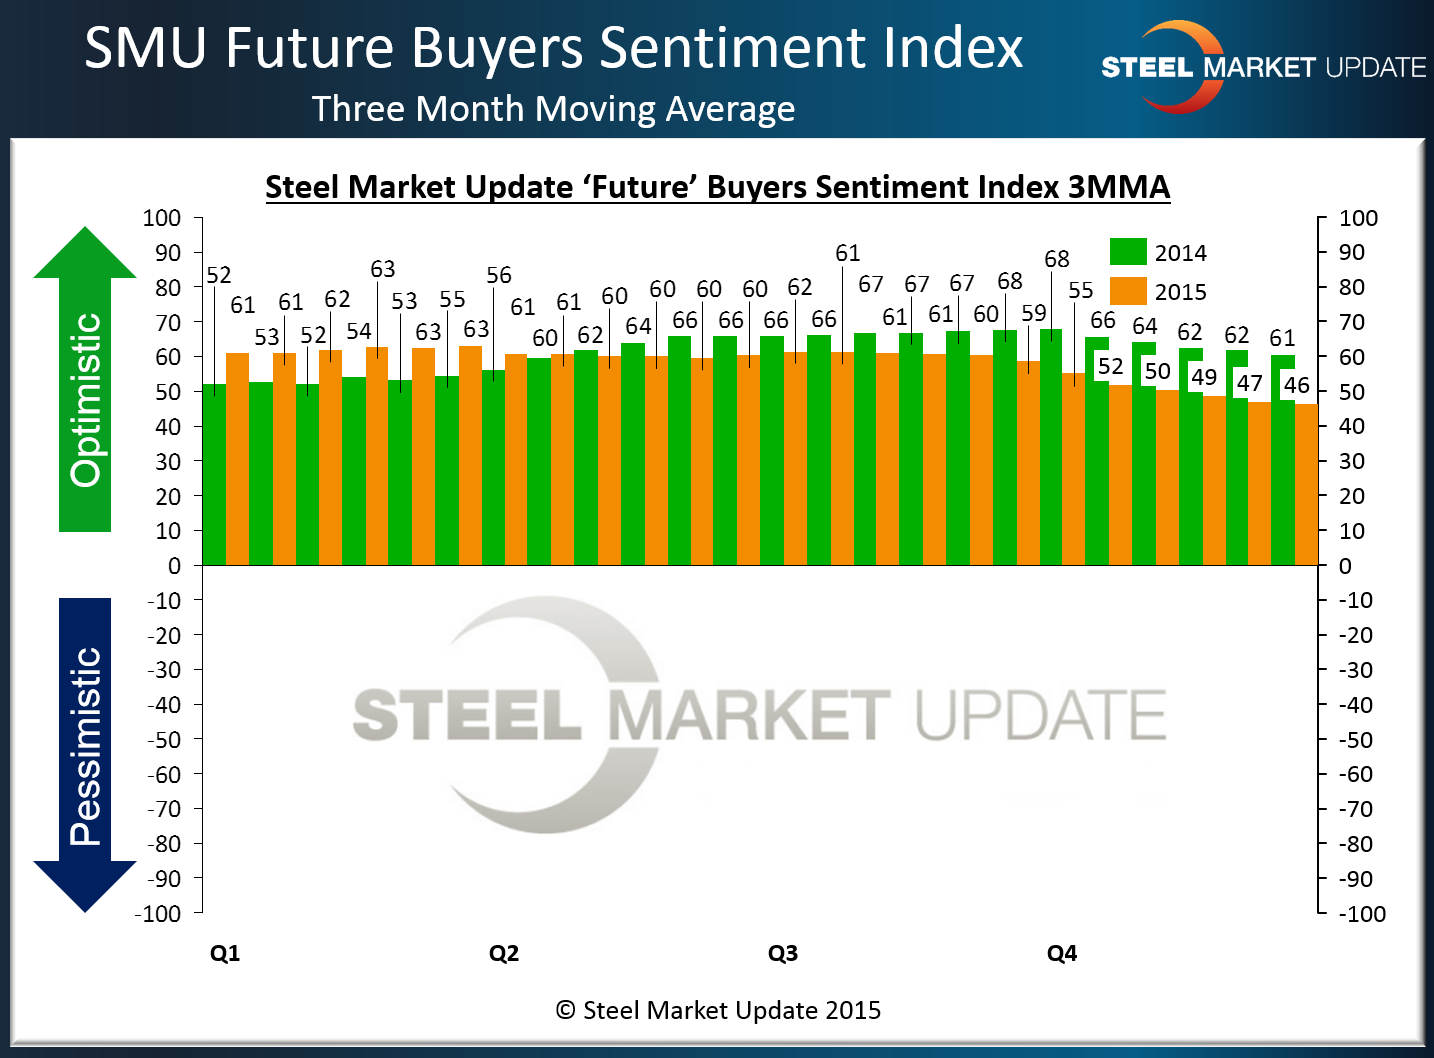
When we asked the same buyers and sellers of steel to look out three to six months into the future we found a slightly more optimistic response with our Future Sentiment Index coming in at +51, up +5 points from 2 weeks ago and just slightly below the +58 reported at this time last year.
Any positive (+) numbers represent optimistic view of market conditions. The larger the number the more optimistic those actively involved in the industry are about business conditions.
3-Month-Moving-Average Trend
In order to smooth out the data we also look at it based on a three month moving average (3MMA) to see if there is a break in the longer term trend. The 3MMA for Current Sentiment is +36.50 which is slightly lower than the +37.17 reported two weeks ago and continues the negative (less optimistic) trend that began at the beginning of August 2015.

The 3MMA for Future Sentiment is being reported as being +46.33 a half point lower than the +46.83 measured two weeks ago. As with Current 3MMA discussed above the trend has been negative (less optimistic) since August 2015.
Based on the 3MMA averages we are not yet ready to make a prediction that the market is getting healthier and those actively buying and selling steel are more optimistic. We think it is coming (our opinion) but we need to get through the Holidays and perhaps a portion (if not all) of the first quarter 2016.
What Our Respondents are Saying
“Agriculture equipment projects for 1st QTR are down. All areas in the south have been very wet and warm slowing down projected sales to end 4th QTR.” Manufacturing company
“…pricing is still low and very competitive. Hopefully demand will kick in once people know the pricing is going to stabilize.” Service center
“Backlog is strong.” Construction related manufacturing company
“December has been a little better than November.” HVAC Wholesaler
About the SMU Steel Buyers Sentiment Index
SMU Steel Buyers Sentiment Index is a measurement of the current attitude of buyers and sellers of flat rolled steel products in North America regarding how they feel about their company’s opportunity for success in today’s market. It is a proprietary product developed by Steel Market Update for the North American steel industry.
Positive readings will run from +10 to +100 and the arrow will point to the right hand side of the meter located on the Home Page of our website indicating a positive or optimistic sentiment.
Negative readings will run from -10 to -100 and the arrow will point to the left hand side of the meter on our website indicating negative or pessimistic sentiment.
A reading of “0” (+/- 10) indicates a neutral sentiment (or slightly optimistic or pessimistic) which is most likely an indicator of a shift occurring in the marketplace.
Readings are developed through Steel Market Update market surveys which are conducted twice per month. We display the index reading on a meter on the Home Page of our website for all to enjoy.
Currently, we send invitations to participate in our survey to almost 600 North American companies. Our normal response rate is approximately 110-170 companies. Of those responding to this week’s survey, 46 percent were manufacturing and 40 percent were service centers/distributors. The balance of the respondents are made up of steel mills, trading companies and toll processors involved in the steel business.
Click here to view an interactive graphic of the SMU Steel Buyers Sentiment Index or the SMU Future Steel Buyers Sentiment Index.


