

Market Data

December 1, 2015
Durable Goods Shipments, Inventories and Orders
Written by Peter Wright
New orders for durable goods in October rose by 3.4 percent month on month to $239.976 billion. This result was better than analyst’s expectations, largely as a result of a surge in the transportation component where non-defense aircraft increased by 81 percent. Motor vehicle and parts orders fell 2.9 percent after rising 1.0 percent in September. Excluding transportation, orders rose 0.5 percent after declining 0.1 percent in September.
The monthly result has been trailing its trend for the last nine months (Figure 1).
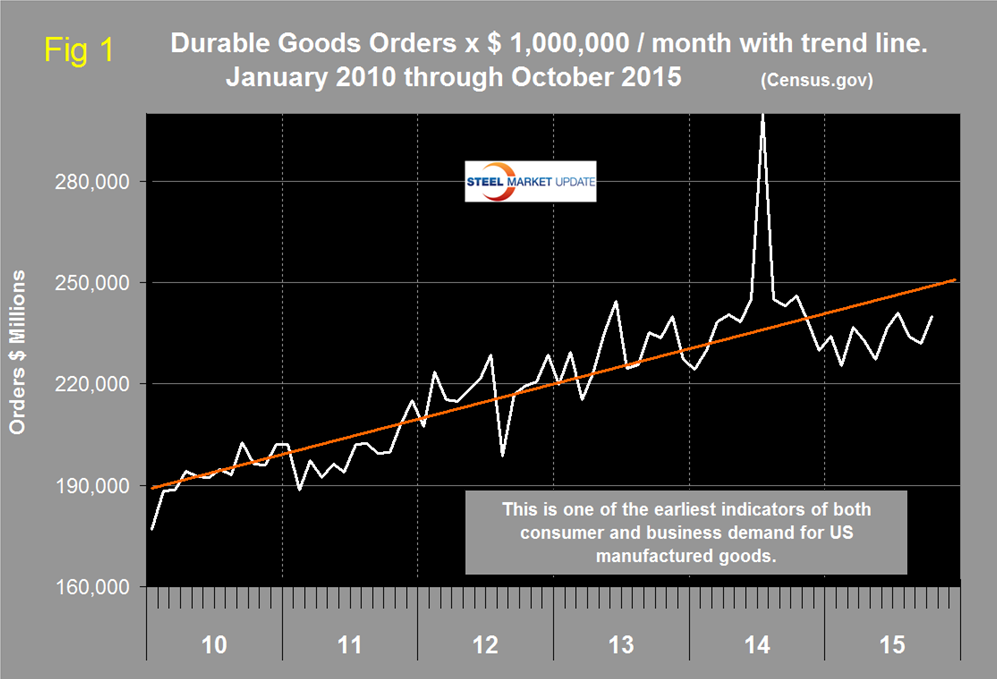
The huge spike in October last year was a manifestation of the surge in civil aircraft orders in July which resulted in the monthly number being a complete outlier in this data series. In total the three month moving average (3MMA) of new orders for durable goods declined by 0.2 percent in October m/m and by 3.8 percent y/y. The y/y growth and the 3MMA of orders is shown in Figure 2 for the period January 1993 through October 2015.
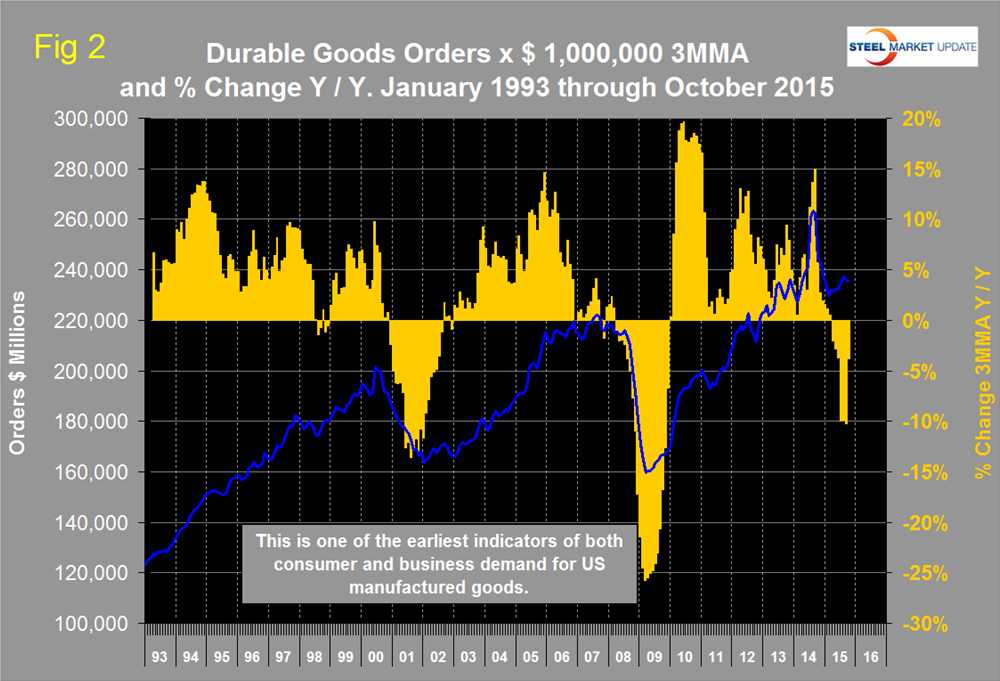
The year over year growth rate of the 3MMA has declined every month since March. This index is routinely whipsawed by both civil and military aircraft orders but we include it in our steel analyses because it is a reality check for other manufacturing data and is described by the Census Bureau as one of the earliest indicators for US manufactured goods.
The Census Bureau press release reads as follows:
New Orders for manufactured durable goods in October increased $6.9 billion or 3.0 percent to $239.0 billion, the U.S. Census Bureau announced today. This increase, up following two consecutive monthly decreases, followed a 0.8 percent September decrease. Excluding transportation, new orders increased 0.5percent. Excluding defense, new orders increased 3.2 percent. Transportation equipment, also up following two consecutive monthly decreases, led the increase, $6.1 billion or 8.0 percent to $82.1 billion.
Shipments of manufactured durable goods in October, down two of the last three months, decreased $2.5 billion, or 1.0 percent, to $240.1 billion. This followed a 0.5 percent September decrease. Transportation equipment, also up following two consecutive monthly decreases, led the increase, $3.3 billion or 0.4 percent to $798.2 billion.
Inventories of manufactured durable goods in October,down five of the last six months, decreased $0.7 billion, or 0.2 percent, to $397.4 billion. This followed a 0.6 percent September decrease. Primary metals, down nine consecutive months, led the decrease, $0.3 billion or 0.9 percent to $35.7 billion.
Capital Goods Nondefense new orders for capital goods in October increased $9.7 billion or 13.2 percent to $83.2 billion. Shipments decreased $1.2 billion or 1.4 percent to $78.8 billion. Unfilled orders increased $4.4 billion or 0.6 percent to $757.8 billion. Inventories increased less than $0.1 billion or virtually unchanged to $175.6 billion. Defense new orders for capital goods in October increased $0.1 billion or 1.0 percent to $9.6 billion. Shipments increased $0.2 billion or 1.5 percent to $10.7 billion. Unfilled orders decreased $1.1 billion or 0.7 percent to $146.8 billion. Inventories decreased $0.6 billion or 2.6 percent to $21.9 billion.
The Federal Reserve Beige Book reported as follows on manufacturing on October 14th: “On the whole, manufacturing conditions were generally sluggish. Reports were mixed across Districts, and among those that saw some increase in activity, such improvement was mild. Chicago and St. Louis reported modest growth in manufacturing activity, and Dallas reported that most manufacturers saw an increase in demand since the last report. On the other hand, Cleveland, Richmond, Boston, Minneapolis, and San Francisco all reported that manufacturing activity was flat or mixed, while the remaining four Districts- New York, Philadelphia, Atlanta, and Kansas City- noted that manufacturing activity had declined. Several Districts reported fairly strong growth in activity related to motor vehicles, aerospace, and transportation equipment. Cleveland, Chicago, and San Francisco all reported that the demand for steel remained weak, with the strong dollar and competition from China cited as factors driving this trend. Falling demand from the energy sector was also cited as a source of weakness by a number of Districts. Activity related to Activity related to primary and fabricated metals was mixed, with Chicago and Kansas City seeing weakness in these sectors, while Philadelphia, St. Louis and Dallas saw some expansion in metals related industries. Demand for high tech manufacturing picked up slightly in the Dallas District, while semiconductor sales slowed in the San Francisco District.”


