

Market Data

July 20, 2015
Oil and Gas Prices and Rotary Rig Counts in July 2015
Written by Peter Wright
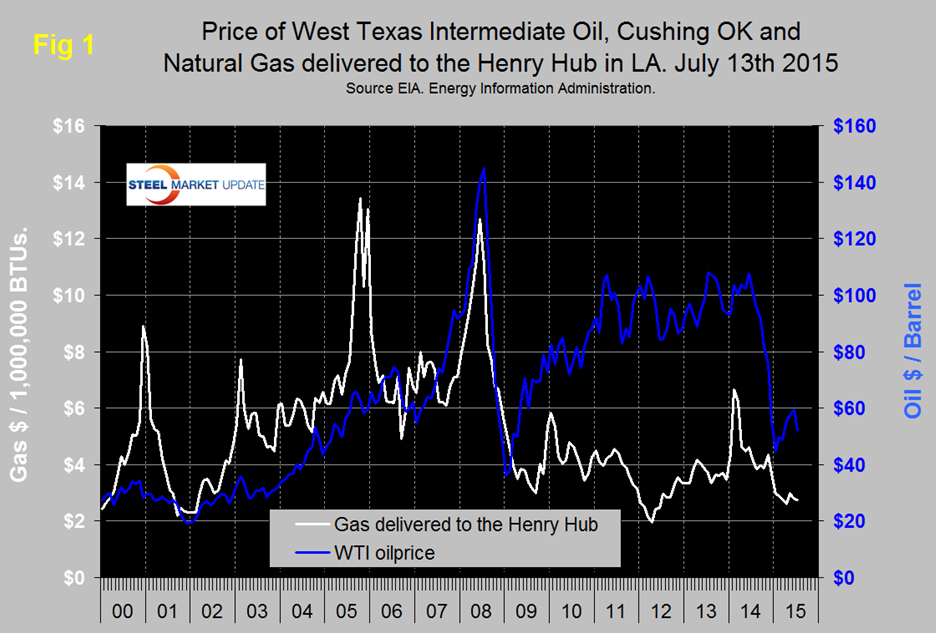
Figure 1 shows historical gas and oil prices since January 2000. The daily spot price of West Texas Intermediate fell below $100/barrel in August and by January 23rd was down to $44.80. By June 15th, the price of WTI had recovered to $59.53. In the last 30 days through July 13th WTI has declined again to $52.19, the latest daily figure available from the Energy Information Administration (EIA). Brent closed at $57.63 on the same day.
If sanctions on Iran are lifted as a result of a nuclear deal then there will be continued downward pressure on oil prices, to some extent this is being factored into the current market price. Iran has the world’s fourth-largest oil reserves and second-largest gas reserves. Lifting the sanctions opens up a well-supplied market to even more resources. Last month Oil-price.net made the following comments regarding shale oil; US oil production has not reduced in the face of falling oil prices. Shale producers are getting more oil out of fewer wells. A tighter control on spending and the application of cheaper technologies has slashed exploration costs, resulting in an increased rate of discovery of new sources in North America over the last six months. So, rather than receding, US shale oil is becoming more plentiful and cheaper to extract. Analysts now estimate that the breakeven point of new shale oil wells is $27.50 per barrel, not counting financing costs. A recent strategy report by OPEC estimates non-conventional oil production would continue to grow by 6 per cent per year up to 2035.
The EIA released its short-term outlook on July 7, 2015, and predicted Brent prices will average $60/b in 2015 and $67/b in 2016, with WTI crude prices $5/b lower. In its weekly statistics the EIA reported U.S. production at just under 9.7 million barrels a day in April. May and June levels dipped to 9.65 and 9.61 mmbd, respectively. The EIA is forecasting production to average 9.5 mmbd in 2015 and 9.3 mmbd in 2016.
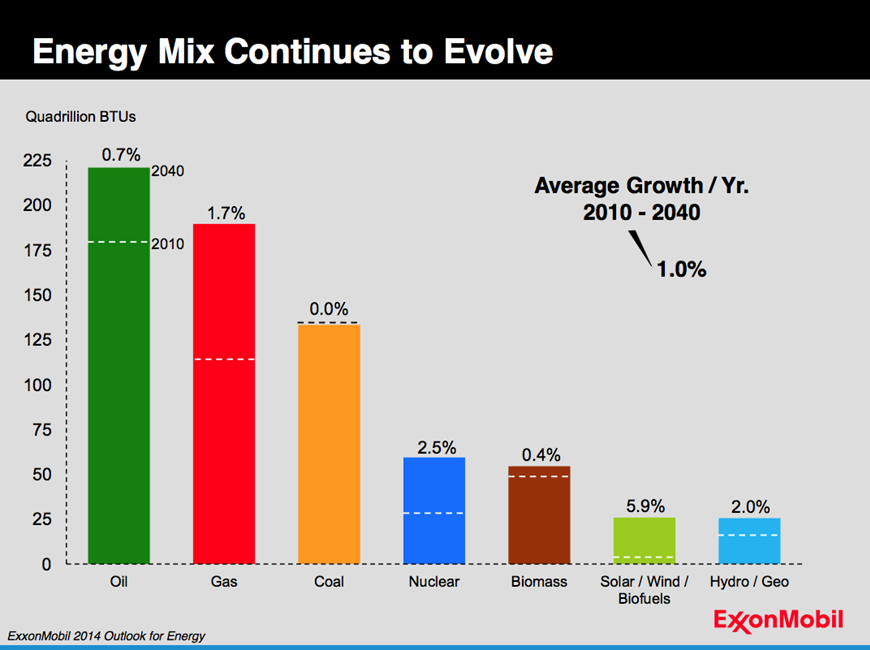
Natural gas delivered to the Henry Hub in Louisiana declined from November through April, recovered by 38 cents to $2.99 in May followed by a decline to $2.75 on July 10th. According to SNL Energy Estimates, U.S. power stations are now generating more power from natural gas than from coal for the first time ever. Increased regulation has led to higher expenses for coal as the shale boom has caused natural gas prices to plummet. This month Exon Mobile published its forecast for the energy mix through 2040 (Figure 2). Oil is projected to grow with a CAGR of 0.7 percent and Natural Gas at 1.7 percent in the years 2010 through 2040.
The severe drop in oil and natural gas prices last year was reflected in the respective drill rig counts. Figure 3 shows the Baker Hughes US Rotary Rig Count which is a weekly census of the number of drilling rigs actively exploring for or developing oil or natural gas in the United States.
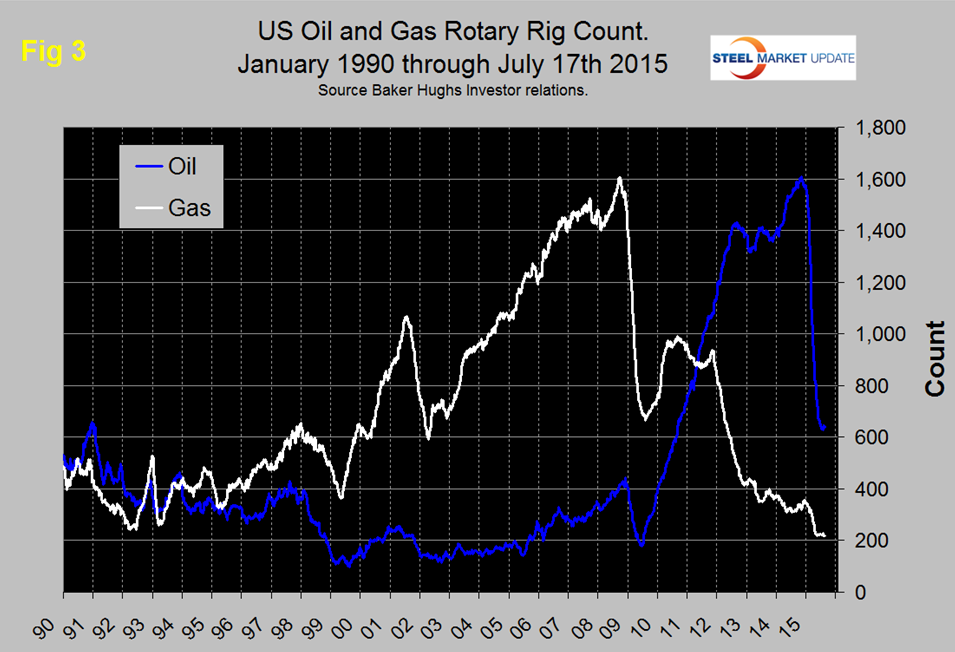
Rigs are considered active from the time they break ground until the time they reach their target depth and may be establishing a new well or sidetracking an existing one. The Baker Hughes Rotary Rig count includes only those rigs that are significant consumers of oilfield services and supplies. The oil rig count did not immediately follow the oil price in the 2nd half of 2014, in fact it moved in the opposite direction between June and October and peaked at 1609 on October 10th. Then the oil rig count collapsed to a low of 628 on June 26th this year. In the last three weeks the oil rig count has increased slightly and stabilized in the range 638 to 645. Year over year the oil rig count was down by 58.9 percent on July 17th. The gas rig count now stands at 218, down by 25.4 percent year over year but stable in the range 217 to 225 for the 16 weeks prior to July 17th. This range is lower than any other time since our earliest data of January 1990. Canadian rig counts on July 17th were as follows, oil 98 operating rigs, down by 56.6 percent y/y and gas 94 rigs down by 39.4 percent y/y. Canadian oil and gas rig utilization is extremely seasonal, peaking in the first quarter of each year then collapsing in the 2nd quarter and recovering into the 1st quarter of the following year.
The total number of operating rigs in the US and Canada is now 1048 an increase of 58 in the last month but a decrease of 53.4 percent y/y. On a regional basis in the US the big three states for operating rigs are Texas, Oklahoma and North Dakota. Texas at 366 on July17th was up by 3 in the last month and down by 59.1 percent since the peak on September 26th. On the same basis Oklahoma at 105 was unchanged and down by 50.8 percent and North Dakota at 68, down 9 and down by 64.0 percent.
Steel Market Update’s view is that there seems to be no end in sight for low global energy prices but that could change overnight if Saudi Arabia is drawn into an active conflict with Iran over the situation in Yemen, or if OPEC reverses its position on production levels. The good news is that US energy production is forecasted to stay strong in spite of the low prices through next year. In the meantime steel demand will be negatively impacted as reduced drilling activity ripples through the supply chain as is already the case for oil country tubular goods.


