Market Data

June 24, 2015
Service Center Inventories Slow to Drop in SMU Apparent Excess Model
Written by John Packard
Before the ink had dried on last month’s service center flat rolled inventory “Apparent Excess/Deficit” report and forecast we knew our forecast was being a bit too optimistic. This was pointed out to us in an email from a large service center who has been following our Apparent Excess since the beginning.
“I read with interest the report on the apparent excess. I understand the logic in using the past 3 year’s average for shipments.
![]() “However, if we hit the shipment levels of 113K/day in May as described in the article, it would represent a 10% increase in rate over the April rate (113K/day vs 103K/day), and a 5% increase in rate over the 2015 YTD ave. Lastly, if we hit 113K/day in May, it will be the highest individual month since last June, which was 115K/day.
“However, if we hit the shipment levels of 113K/day in May as described in the article, it would represent a 10% increase in rate over the April rate (113K/day vs 103K/day), and a 5% increase in rate over the 2015 YTD ave. Lastly, if we hit 113K/day in May, it will be the highest individual month since last June, which was 115K/day.
“The 113K/day rate may absolutely come true, but it just occurred to me in looking at the figures that if it did, it would represent a significant change from where we’ve been for quite some time, and might in itself represent something larger. Perhaps if nothing else, the fact that price increases are sticking might be reason enough for shipments to rise, assuming service center customers are paying attention and stepping up their buying rates.
“We’re down nearly ½ million tons in FR so far in 2015, and most assume it’s lower buying levels in Energy, Ag, and Heavy Equip. Assuming those industries are not going to show positive trend growth from the first 4 month’s rate, we’ll need to see other industries buying more to offset…”
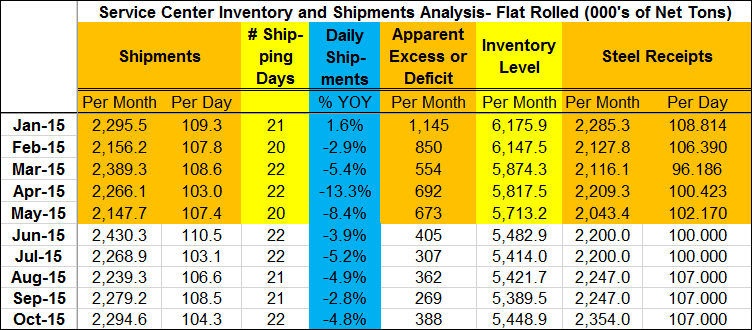
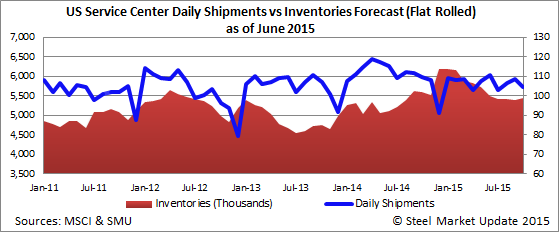
The actual daily shipping rate for flat rolled out of the MSCI service centers was 107,400 tons per day or 2,147,700 tons for the month. Our aggressive forecast of 113,000 tons per day was off by 5,600 tons per day or a total of 112,000 tons for the month.
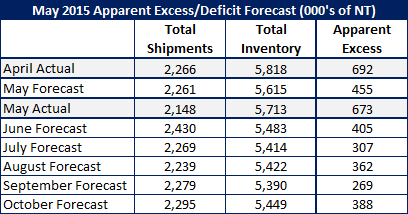
We did much better when it came to steel receipts for the month of May. We had projected that flat rolled receipts would average 102,900 tons per day. The actual number was 102,170 tons and final inventories came in at 5,713,200 instead of the 5,615,000.
We had forecast apparent excess to drop to +454,000 down 238,000 tons below the April +692,000 tons reported last month.
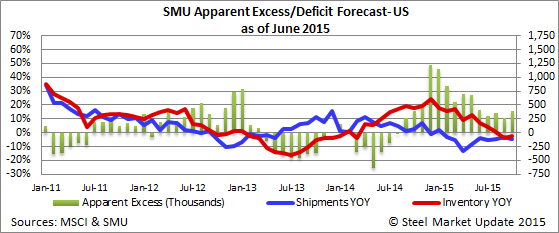
Based on the latest MSCI data and our analysis based on our Apparent Excess/Deficit model, the flat rolled steel service centers have an Apparent Excess of +673,000 tons of inventory as of the end of May.
Moderating Our Overly Optimistic View Going Forward
With the exception of January, all of the other months have seen shipment rates below those of the previous year. January was +1.6 percent, February was -2.9 percent, March was -5.4 percent, April was -13.3 percent and May was -8.4 percent.
Our new forecast continues this negative year-over-year shipment trend through the balance of this year. We have not significantly altered our shipment number as we had moderated the number for June, July, August and September last month (after being aggressive with May’s numbers).
Our shipment forecast is based on the three year average. In the process, the numbers are lower than what we saw last year.
Our receipts forecast is assuming that there is a reduction in foreign steel receipts as the year progresses and that service centers, in spite of the price increase announcements and trade case, will continue to balance inventories. Our receipt forecast is below the three year average for each month which brings down the Apparent Excess forecast to “reasonable” levels.
However, if we are incorrect and the distributors bring in material at the three year moving average or greater, then the Apparent Excess numbers will be approximately 200,000 tons per month higher than our forecast shown below.
The challenge will be can the service centers control their inventories despite the price announcements and issues associated with the trade case on coated products (and potential trade case on cold rolled and hot rolled steels)?