Market Data

April 23, 2015
China’s Economic Statistics Q1 2015
Written by Peter Wright
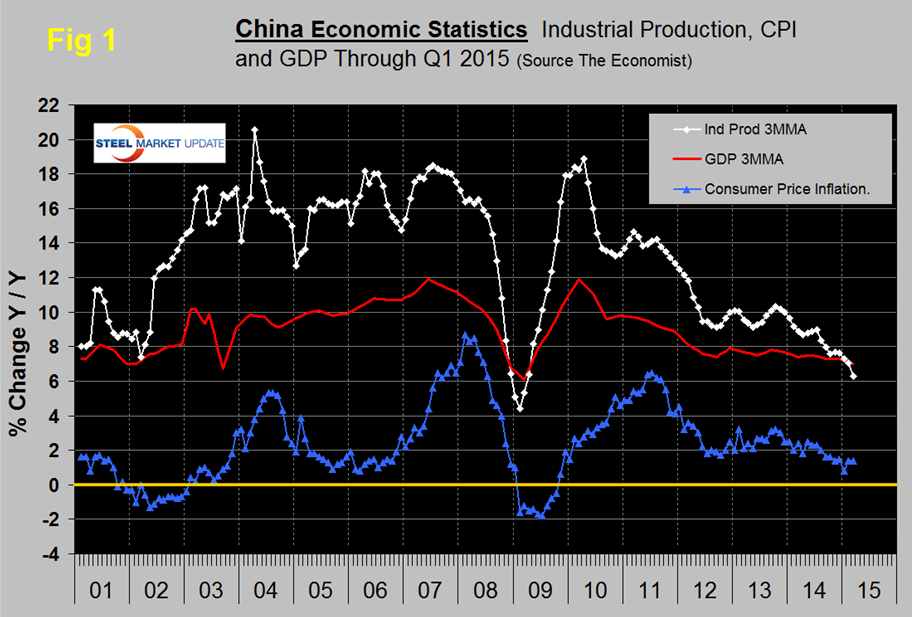
The graphic below shows published data for the growth of GDP, industrial production and consumer prices through the 1st Q of 2015. The GDP and industrial production portions of this graph are three month moving averages. GDP grew 7.3 percent y/y in both the 3rd and 4th quarters of 2014, declined to 7.0 percent in Q1 2015 and has been declining since Q1 2010. The most recent data was the weakest since Q1 2009, reflecting broad weakness across agriculture, manufacturing and construction. The housing slump is hurting spending in a wide range of sectors and is pressuring corporate profits, a negative for hiring and business investment. Service industries continue to grow strongly which is the declared intent of the central government.

The growth of industrial production year over year on a three month moving average basis which had been averaging 16 percent from early 2003 to mid-2008 decreased in March to 6.3 percent and has declined for six straight months. The single month of March result was the lowest since February 2009 as the housing slump has cut demand for products such as metal, cement, iron, and other building products. The decline in electricity production in March mirrors the slowdown in the broader economy, as household and business energy demand is subdued.
Consumer price inflation has been falling for about 18 months but in March was unchanged at 1.4 percent. This breather suggests that prices are close to bottoming. Earlier this month Stratfor commented as follows; The anti-corruption campaign is one element in a broader evolutionary process driven by the realization that the transition between China’s former economic model (based on low-cost exports and investment-led construction) and new economic model (based on domestic consumption, services and high value-added manufacturing) will entail five to 10 years of immense social, economic and political strain. Simply put, the old model, whose legitimacy rested on the promise of ever-rising material prosperity and stability, is no longer viable. As China tries to transition away from low-end manufacturing and economic stimulus driven by government-financed construction, it is the low end of the economic spectrum that will be disproportionally affected. A gradual shift in its economic model would allow China to slowly metabolize these displaced workers, but it is far from certain that China has the time to allow for this slow change, as the rest of the global economy is shifting with or without Chinese consensus.”
Last Friday, China tried to pour some cold water over its stock market bubble. After a five-percent crash in after-hours future trading, the Chinese government reversed course and shifted gears back to stimulation. The regime cut the Reserve Requirement Ratio by 1 percent to 18.5 percent which was the largest cut since the early days of the global recession in 2008. This is the money banks have to hold as cash reserves in their vaults or at the central bank. The higher the ratio, the less money banks can dish out in the forms of loans to businesses (and pretty much everybody else). This means banks can now loan out $200 billion more with their existing reserves, money the regime hopes will go into real estate loans above all. Recently, however, real estate has been on the decline and Chinese people have been more interested in ever rising stock prices.
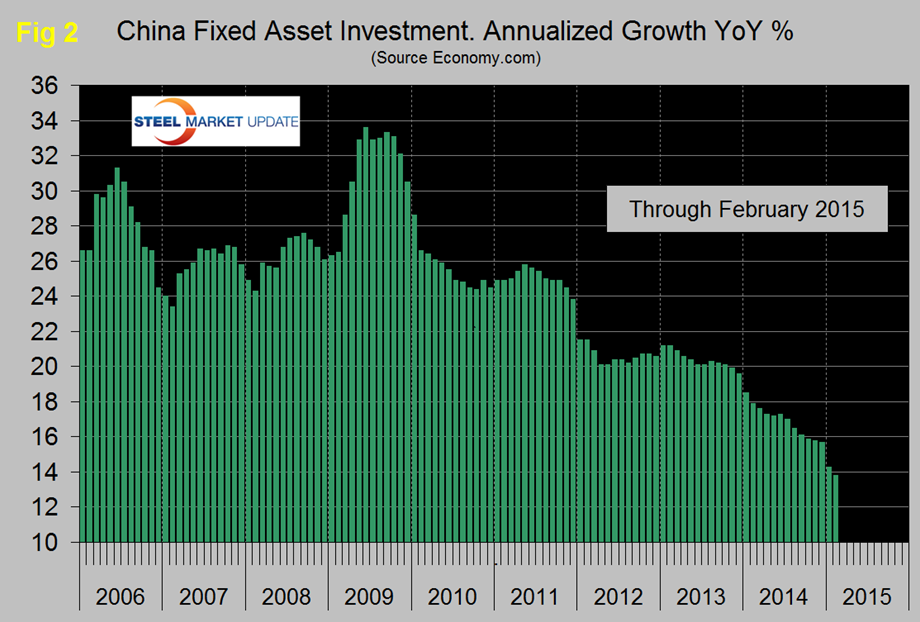
Figure 2 shows the growth of fixed asset investment y/y. The decline experienced in 2013 accelerated through all of 2014 and accelerated again in the first two months of 2015. We understand that this data includes real-estate purchases so is not a direct reflection of constructional steel demand. We are assuming that the steel on the ground portion of this data follows the overall trend and that the contraction in FAI is in accordance with the stated objective to rebalance the economy in favor of consumer consumption. Weaker investment in fixed assets is contributing to slower demand across a number of industries including steel and is pressuring corporate profits. Delays to infrastructure projects around the Lunar New Year is also probably aggravating the situation.
SMU Comment: The fears of the global steel industry that Chinese overcapacity would eventually become critical are coming to pass. In 2014 the growth in China’s steel production was only 0.9 percent and in Q1 2015 steel production contracted at 1.4 percent year over year. December is the latest data we have for China’s steel exports but the volume doubled in the 13 months between November 2013 and December 2014 to 10,184,000 tonnes. That’s over ten million metric tons in one month! The total for Q4 2013 was 15,452,000 tonnes, for Q4 2014 was 28,477,000 tonnes, an increase of 84.3 percent. Chinese steelmakers are trying to dispose of their excess production in any markets that will accept them.


